
Color-Coded Crop Needs Analysis for North Carolina Counties
This presentation provides a detailed analysis of crop needs across various counties in North Carolina, with color-coded maps for easy visualization. Utilizing data segmented by crop needs percentage ranges (0-10%, 10-40%, 40-70%, 70-100%, and over 100%), the charts allow for quick assessment of agricultural requirements in counties such as Alleghany, Currituck, Surry, and many others. Users can interact by modifying slide templates to enhance information display, facilitating discussions on agricultural planning and resource distribution.

Color-Coded Crop Needs Analysis for North Carolina Counties
E N D
Presentation Transcript
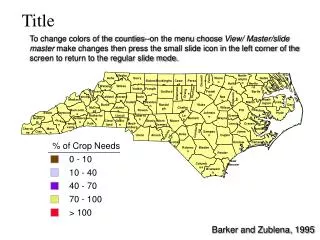
% of Crop Needs 0 - 10 10 - 40 40 - 70 70 - 100 > 100 To change colors of the counties--on the menu choose View/ Master/slide master make changes then press the small slide icon in the left corner of the screen to return to the regular slide mode. Title Alleghany North-ampton Currituck Ashe Surry Warren Gates Camden Vance Stokes Rockingham Caswell Person Granville Pasquotank Halifax Hertford Perquimans Watauga Wilkes Yadkin Forsyth Chowan Avery Guilford Franklin Bertie Durham Allamance Orange Mitchell Yancey Caldwell Alexander Davie Nash Edgecombe Madison Wash-ington Iredell Davidson Martin Tyrell Burke Randolph Wake Dare McDowell Catawab Chatham Wilson Buncombe Rowan Pitt Beaufort Swain Haywood Johnston Hyde Rutherford Lincoln Cabarrus Lee Greene Graham Henderson Harnett Wayne Jackson Cleve-land Gaston Stanly Mont-Gomery Moore Beaufort Transyl-vania Polk Meck-lenburgh Lenoir Craven Cherokee Macon Pamilco Cumberland Clay Sampson Jones Hoke Richmond Union Anson Duplin Scotland Onslow Carteret Robeson Bladen Pender New Hanover Columbus Brunswick Barker and Zublena, 1995


