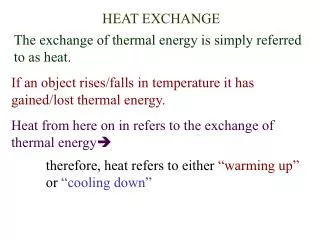
Heat Temperature Exchange Process
Learning objectives. Compare

Heat Temperature Exchange Process
E N D
Presentation Transcript
1. Heat & Temperature Exchange Process Isotherms and temperature gradients
Processes that control temperatures
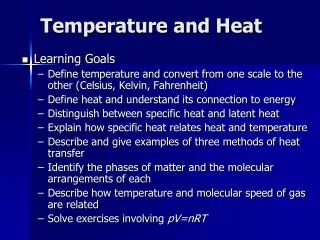
2. Learning objectives Compare & contrast temperature and heat
Given observed temperatures, analyze the temperature field using isotherms.
Identify strong and weak temperature gradients using the temperature analysis.
Describe the mechanisms that control temperature in the Earth-atmosphere system.
Using temperature records from selected global sites, identify which temperature control mechanism (s) account for the observations.
Describe the factors that control temperatures that are observed in Grand County
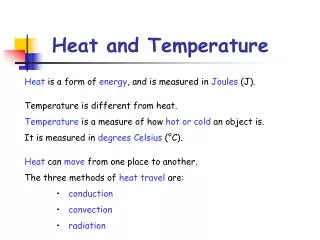
3. Temperature Temperature
one of the basic elements used for weather & climate
varies, sometimes considerably, seasonally, daily, & by the hour
An example observed in Grand County?
How are temperatures analyzed on weather charts?
Use a technique called, isoplething (same+value)
Draw isotherms (iso=equal; therm=temp)
at 2, 5, or 10 deg intervals
temperature analysis important for forecasting
visually able to see patterns associated with
fronts (surface and upper air)
severe thunderstorms features
tropical cyclone patters
can calculate temperature gradients ?T/ ?d (deg C/km)
4. Analyzing temperature fields Rules for drawing isotherms on weather charts
Draw isotherms at 2, 5, or 10 deg intervals
Label each isotherm
Interpolate temperature values between observation points and draw isotherms accordingly
Isotherms never cross each other
Make isotherms smooth curved lines rather than a series of straight lines.
Isothermal analyses are made for
surface charts
upper air charts
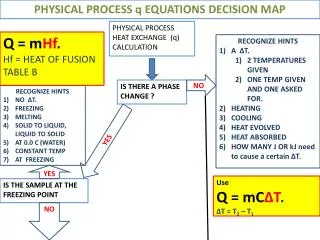
5. Temperature gradients Temperature gradient = ?T/ ? distance (deg C/km)
Strength of gradient can be determined from isothermal analysis
Strong temperature gradient are found in areas where isotherms are close together
Weak temperature gradient are found where isotherms are spaced far apart.
6. Temperature controls What controls the temperatures we observe?
Based on incoming solar radiation and the seasons, an even distribution of temperatures would be observed from the tropics to the polar regions
We don�t observe this pattern, why?
Several factors contribute
Can we observe differences in Grand County?
Factors that control the temperature on Earth
land-ocean heating
ocean currents
altitude
geographical position
cloud cover
7. Land-Ocean differences Land changes temperature faster compared to water
Land heats more rapidly & to high temperatures
Land cools more rapidly & to cooler temperatures
Several physical properties & processes
convective currents distribute heat in water bodies
solar radiation reaches deeper into water than soils
specific heat of water greater than soil
8. Latitude changes of temperature If we consider latitude alone, over the USA, temperature decreases about 1 deg C per degree of latitude.
Example: Compare the mean average temperature for Kansas City and Winnipeg
Average temperature for Winnipeg = 2 deg C
Average temperature for Kansas City + 13.3 deg C
Therefore, if we consider just latitude over a continent, we should expect about 1 deg/deg of lat
9. Water-Land Differences Compare the mean annual temperatures between Vancouver, British Columbia and Winnipeg, Manitoba (see Fig. 3-4, p. 54 of Chap 3-text supplement).
Because of the differences in the ways land and water heat and cool
Vancouver has a more moderate annual temperature change
Vancouver has a lower maximum temperature in the summer
Winnipeg�s mean Jan temperature is 20 deg C cooler than Vancouver
Winnipeg�s July temperature is about 3 deg warmer than
Vancouver
10. Global Ocean Currents There are several ocean currents around the world
There are warm and cold currents (see Fig. 3.7 of the text supplement)
Type of current affects the mean temps of locations near currents.
warm currents moderate the temperatures
North Atlantic Drift influences temperatures in Europe
Compare New York with London
Compare Northern Hemisphere with Southern Hemisphere (see Fig. 3.1 in text supplement)
11. Ocean Currents