Download
1 / 63
680 likes | 954 Vues
Plan for Collaborating on a Harford County Community Health Improvement Plan. Community Health Improvement Plan (CHIP) Coalition Steering Committee November 2011. Today’s Agenda. Rationale for a community health needs assessment and improvement plan Proposed approach for the planning process

E N D
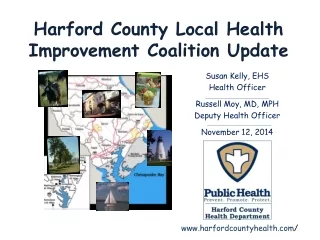
Plan for Collaborating on a Harford County Community Health Improvement Plan Community Health Improvement Plan (CHIP) Coalition Steering Committee November 2011
Today’s Agenda • Rationale for a community health needs assessment and improvement plan • Proposed approach for the planning process • Broad-brush review of Harford County health data and priorities • Next steps
Who Says We Need a Plan for Improving the Community’s Health? • CHNA – For Hospitals • Federal health care reform, as well as Federal and State requirements, mandate community health needs assessment (CHNA). • SHIP – For State Health Departments • Maryland’s Health Care Reform Coordinating Council reaffirms the importance of a State Health Improvement Process (SHIP). • LHIP – For Local Health Departments • National public health accreditation requires a Local Health Improvement Plan (LHIP).
What’s Required? Local Health Departments State Health Improvement Process (SHIP) obligations requiring a Local Health Improvement Coalition (LHIC) and Action Plan Obesity Prevention Task Force report due to the County Council Public Health Accreditation Board (PHAB) prerequisite Hospitals State community benefits report to HSCRC Federal IRS Form 990 Schedule H New federal health care reform requirements for Community Health Needs Assessment (CHNA)
Can We Build on Harford County Efforts? Federal Health Care Reform Requirements Hospital CHNA Mandates LHD SHIP Mandates COMMUNITY HEALTH IMPROVEMENT PLAN Healthy Harford Activities
A Common Vision and Mission? VISION To make Harford County the healthiest community in Maryland MISSION To protect, promote and improve the health, safety and environment of the residents of Harford County through community assessment, education, collaboration and assurance of services
What is a Public Health Planning Process? MAPP • MAPP = Mobilizing for Action through Planning & Partnerships • Developed by NACCHO & CDC in 2001 • Consists of 4 assessments: • Quantitative data review • Qualitative data review • Internal review • External review
How Can We Get Started? One Approach • Present the quantitative data we currently have to community audiences • Then solicit reaction, including qualitative feedback • In order to engage in a discussion about strengths, weaknesses, opportunities & threats • To gain consensus on priorities, goals, strategies & action steps
Let’s start at the beginning . . . PREGNANCY DATA
Infant Mortality RatesHarford County & Maryland2001-05 to 2006-10 Source: Maryland Vital Statistics
Infant Mortality RatesHarford County, By Race2000-04 to 2005-09 Source: Maryland Vital Statistics
Low Birthweight RatesHarford County & Maryland2000-04 to 2005-09 Source: Maryland Vital Statistics
Low Birthweight RatesHarford County, By Race2004 vs. 2009 Source: Maryland Vital Statistics
Teen Birth RatesHarford County & Maryland2004 vs. 2009 Source: Maryland Vital Statistics
Teen Birth RatesHarford County, By Race2004 vs. 2009 Source: Maryland Vital Statistics
1st Trimester Prenatal Care RatesHarford County & Maryland2004-06 to 2007-09 Source: Maryland Vital Statistics
1st Trimester Prenatal Care RatesHarford County, By Race2004 vs. 2009 Source: Maryland Vital Statistics
For pregnancy outcomes, Harford County ranks better than the State, but health disparities exist
Let’s move on to conditions that affect us over the years . . . CHRONIC DISEASE DATA
Top 7 Causes of DeathHarford County, 2009 450 433 136 99 59 43 41
Heart Disease Mortality RatesHarford County & Maryland2004-06 to 2007-09 Source: Maryland Vital Statistics
Heart Disease Mortality RatesHarford County, By Race2004-06 to 2007-09 Source: Maryland Vital Statistics
Cancer Mortality RatesHarford County & Maryland2004-06 to 2007-09 Source: Maryland Vital Statistics
Cancer Mortality RatesHarford County, By Race2004-06 to 2007-09 Source: Maryland Vital Statistics
Stroke Mortality RatesHarford County & Maryland2004-06 to 2007-09 Source: Maryland Vital Statistics
Stroke Mortality RatesHarford County, By Race2004-06 to 2007-09 Source: Maryland Vital Statistics
COPD Mortality RatesHarford County & Maryland2004-06 to 2007-09 Source: Maryland Vital Statistics
COPD Mortality RatesHarford County, By Race2000-07 to 2004-09 Source: Maryland Vital Statistics
For chronic disease outcomes, Harford County ranks worse than the State Note: Rates are deaths per 100,000 population
Now let’s look at lifestyle choices . . . LIFESTYLE DATA
Leading Actual Causes of DeathUnited States, 2000 Source: Mokdad AH, et al, JAMA, Mar 2004
Adult Smoking RatesHarford County & Maryland2005-07 to 2008-10 Source: CDC Behavioral Risk Factor Surveillance System
Adult Cigarette Smoking RatesHarford County & Maryland2000 to 2010 Source: CDC Behavioral Risk Factor Surveillance System
Youth Tobacco Use RatesHarford County & Maryland2000 to 2010 Source: Maryland Youth Tobacco Survey
Secondhand Smoke Exposure RatesHarford County & Maryland, 2008 Source: CDC Behavioral Risk Factor Surveillance System
Adult Obesity/Overweight RatesHarford County & Maryland2005-07 to 2008-10 Source: CDC Behavioral Risk Factor Surveillance System
Adult Obesity/Overweight RatesHarford County2010 CHAP & BRFSS Data
Physical Activity Rates*Harford County & Maryland2005-07 to 2008-10 * NOTE: Moderate activity 30 minutes/day, 5 days/week Source: CDC Behavioral Risk Factor Surveillance System
Physical Activity RatesHarford County2010 CHAP & BRFSS Data NOTE: Moderate activity 30 minutes/day, 3 days/week NOTE: Moderate activity 30 minutes/day, 5 days/week
Fruits & Vegetables Intake Rates*Harford County & Maryland2005-07 to 2008-10 Source: CDC Behavioral Risk Factor Surveillance System * NOTE: 5 or more daily servings of fruits or vegetables
Fruits & Vegetables Intake RatesHarford County2010 CHAP & BRFSS Data Fruits/Vegetables, 37.1% Fruits, 18.3% NOTE: 3 more daily servings of fruit and 3 more daily servings of vegetables
In lifestyle choices, Harford County ranks worse than or even with the State
And what about access to health care . . . ACCESS DATA
% Who Could Not Afford to See M.D.Harford County & Maryland2005-07 to 2008-10 Source: CDC Behavioral Risk Factor Surveillance System
Adult Influenza Vaccination RatesHarford County & Maryland2005-07 to 2008-10 Source: CDC Behavioral Risk Factor Surveillance System