Download
1 / 3
30 likes | 152 Vues
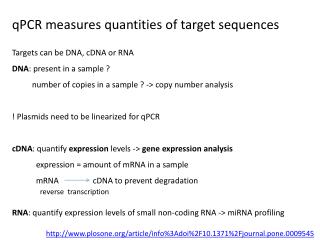
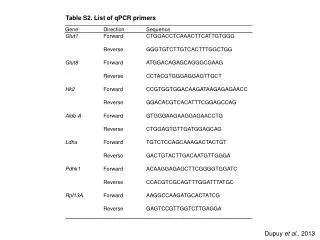
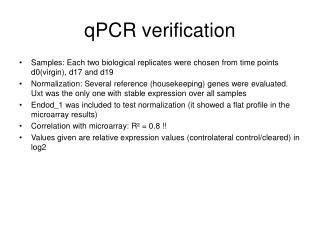
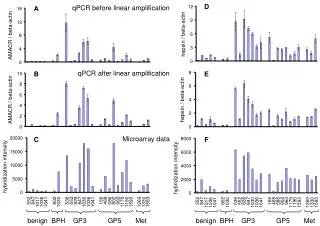
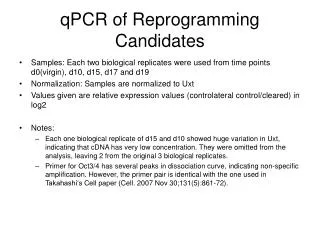
This study examines the expression of reprogramming candidates using quantitative PCR (qPCR) across multiple developmental time points (d0, d10, d15, d17, and d19). Each time point includes two biological replicates, normalized to Uxt for accurate relative expression values in log2. Notably, substantial variation in Uxt at d10 and d15 led to the omission of these replicates due to low cDNA concentration, resulting in a more reliable dataset. Caution is advised regarding Oct3/4 primers, which showed non-specific amplification, despite their similarity to previously validated primers.

E N D
qPCR of Reprogramming Candidates • Samples: Each two biological replicates were used from time points d0(virgin), d10, d15, d17 and d19 • Normalization: Samples are normalized to Uxt • Values given are relative expression values (controlateral control/cleared) in log2 • Notes: • Each one biological replicate of d15 and d10 showed huge variation in Uxt, indicating that cDNA has very low concentration. They were omitted from the analysis, leaving 2 from the original 3 biological replicates. • Primer for Oct3/4 has several peaks in dissociation curve, indicating non-specific amplification. However, the primer pair is identical with the one used in Takahashi‘s Cell paper (Cell. 2007 Nov 30;131(5):861-72).
Raw values of biological replicates *omitted