Download
1 / 23
230 likes | 384 Vues
Development of a Stormwater Retrofit Plan for Water Resources Inventory Area (WRIA) 9 and Estimation of Costs for Retrofitting all Developed Lands of Puget Sound. flow and water quality indicators AND TARGETS R ichard Horner. Components and Relationships of a Watershed Ecosystem. Definitions.

E N D
Development of a Stormwater Retrofit Plan for Water Resources Inventory Area (WRIA) 9 and Estimation of Costs for Retrofitting all Developed Lands of Puget Sound flow and water quality indicators AND TARGETS Richard Horner
Definitions • Indicators: Small set of stream hydrology and water quality variables with documented linkages to watershed conditions on the one hand and aquatic biological community integrity on the other • Targets: Numerical values of habitat indicators to achieve specific biological goals, attained through appropriate stormwater management strategies • Goals: Protection to sustain no further losses of biological integrity and selected enhancements to restore some lost resources
Biological Indicator Benthic Index of Biotic Integrity (B-IBI)
Project Modeling Framework LU/LC—land use/ land cover
Scenarios • Land use/land cover: (1) Projected new developments on “greenfields”, (2) forecast redevelopment of already developed property, and (3) retrofitting static existing development • Stormwater management: Emphasizing green stormwater infrastructure (GSI) designs, but also including conventional practices • GSI is aimed at reducing quantity of surface runoff and improving the quality of any remnant by exploiting vegetation and soils to infiltrate and evapotranspire water and harvesting runoff for some use • Rain gardens, rain barrels or cisterns, porous parking lot pavements, conventional wet ponds
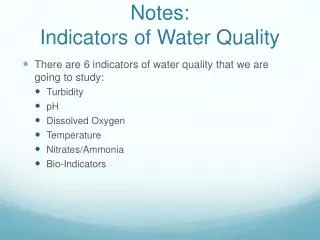
Selected Indicators • 3 hydrologic indicators selected based on 7 criteria: • High pulse count (HPC) • High pulse range (HPR) • 2-year peak:mean winter base flow ratio (PEAK:BASE) • Project’s scope set total suspended solids (TSS) as the prime water quality indicator However, also interest in WDOE water quality criteria variables; available data permitted establishing statistical relationships between TSS and several of these variables, which are hence de facto indicators.
HPR High flow pulses: Occurrence of daily average flows ≥ high-flow threshold set at 2X long-term mean daily flow rate 2 x mean flow HPC = 21
Principles of Target Selection • “Range of outcomes” approach—spectrum of possible goals and associated targets can be investigated, instead of a few discrete ones • Frame all goal assessments in terms of best estimates as well as uncertainty
Possible Ways to Set Hydrologic Targets by These Principles • Set target (X) necessary to achieve specific B-IBI score (Y), with confidence interval—tool is linear regression: • Y = aX + b • Set target necessary for B-IBI score in a certain range—tool is logistic regression • Equation used to estimate probability of achieving B-IBI in desired range at a set confidence level
HPC and HPR Targets • Based on King County data set from 16 flow and B-IBI stream stations • Analysis produced equations passing statistical quality tests for: • Linear regressions with log B-IBI as a function of HPC, HPR, or their logarithms • Logistic regressions with B-IBI in ranges ≥ 30% and ≥ 60% of the maximum score and HPC, HPR, or their logarithms as independent variable
PEAK:BASE Targets • Based on UW data set from 46 stream stations with B-IBI and measured or modeled flow data • Analysis produced equations passing statistical quality tests for: • Logistic regressions with B-IBI in ranges ≥ 30%, ≥ 40%,≥ 50%, ≥ 60%, and ≥ 70% of the maximum score and PEAK:BASE or its logarithm as independent variable
Linear Regression Examples Best estimate (at 90% confidence) to increase B-IBI from a lower level to ~ 50 percent of max. (25) is HPC < 5-10; more cautiously, at 80% confidence of meeting the goal with the least optimistic forecast (low B-IBI estimate),HPC ≤5 To keepB-IBI above “poor”(>16, or > 32% of max.), best estimate of HPC = 15
SUSTAIN Output HPC Each point represents a possible BMP strategy B-IBI
Logistic Regression Examples • Suppose goal is to raise B-IBI to ≥ 50% of maximum score • Suppose SUSTAIN identifies two strategies yielding PEAK:BASE = 18 and 15 • Logistic regression equation for this goal range calculates an expression of the odds of B-IBI in the desired range at a 95% confidence level, which is translated to probability, P At PEAK:BASE = 18, P = 0.63, somewhat probable At PEAK:BASE = 15, P = 0.73, more probable
Expansion of Water Quality Coverage • Starting point: SUSTAIN produces a set of BMP strategies and costs to achieve a range of possible hydrologic and biological outcomes, with estimated TSS concentrations • Question: With a selected strategy, what is the risk of exceeding water quality criteria for: - Turbidity - Metals • Large Green River watershed database offered potential to develop statistical relationships with strong confidence levels
Statistical Analysis Linear regression equations derived from storm flow data and from all data: • Turbidity (NTU) = a2Y + b2 Y = TSS (mg/L) • Total M (µg/L) = a3Y + b3 M = Metal (copper [Cu] or zinc [Zn]) • Dissolved M (µg/L) = a4Z + b4 Z = Total metal
Quality of the Relationships • Y or Z explains differing amounts of the variability in turbidity, total M, or dissolved M • But, large quantity of data makes 95% confidence bands on ai and bi values fairly narrow • Difference in turbidity using all data or just storm data is 10-17% for TSS = 1-7 mg/L, declining to ≤ 2 percent with TSS > 75 mg/L • DCu deviates by ≤ 15 percent over TSS range with two data sets; however DZn deviates much more, dictating caution in that risk assessment
Example 1 Assume upstream (background) turbidity = 8 NTU and TSS = 12 mg/L downstream of a discharge; using equations from all data: • Best estimate of downstream turbidity = 8.8 NTU • For a conservative estimate, maximum turbidity at 95% confidence = 9.4 NTU—should not be regarded as a prediction, just a means to assess risk • Water quality criterion: ≤ 5 NTU increase when the background ≤ 50 NTU; ≤ 10% increase when the background > 50 NTU • Maximum increase = 9.4 NTU – 8.0 NTU = 1.4 NTU (< 5 NTU criterion; low risk of exceeding)
Example 2 Assume TSS = 90 mg/L downstream of a discharge ; using equations from all data: • Maximum estimates of downstream copper at 95% confidence— Total copper = 7.7 µg/L Dissolved copper = 4.0 µg/L • Acute water quality criterion: Dissolved copper ≤ 4.6 µg/L at total hardness = 25 mg/L as CaCO3 (but not enough difference to conclude there is not a risk of exceeding)
Qualifications • Future onset of retrofits and other changes in WRIA 9 could change the relationships between TSS and other pollutants in the area’s streams, or may not • Dissolved metals could increase in relation to TSS, or could decrease • Therefore, methods presented here are potentially useful, when used conservatively, only in assessing risk of surpassing criteria, but not for predicting specific concentrations • Also, they should not be used for analyzing anything but water quality in the streams of WRIA 9
Summary • Thanks to available regional data, numerical targets can be set for three hydrologic indicators, at known levels of certainty, as necessary to meet a range of possible aquatic biological goals. • SUSTAIN identifies management strategies (with costs) expected to hit those targets. • Thanks to other data from WRIA 9 itself, the risk can be assessed of exceeding certain water quality criteria with those management strategies in place.