Download
1 / 43
430 likes | 575 Vues
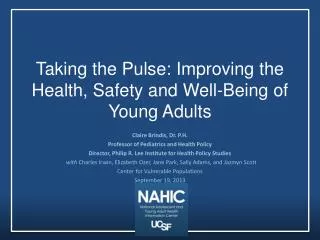
Taking the Pulse of the U.S. Health Care System Quality, Safety and Efficiency International and National Perspectives. Cathy Schoen Senior Vice President August 21, 2006 Harvard Quality Colloquium cs@cmwf.org www.cmwf.org. US Health System: International and National Experiences.

E N D
Taking the Pulse of the U.S. Health Care System Quality, Safety and Efficiency International and National Perspectives Cathy Schoen Senior Vice President August 21, 2006 Harvard Quality Colloquium cs@cmwf.org www.cmwf.org
US Health System: International and National Experiences • U.S. highest cost health system in the world yet often fails to deliver high quality, high value care • Quality varies widely despite centers of excellence • Access is of increasing concern • Uninsured and underinsured • International view of safety, quality and access from patients’ perspectives • US mixed performance • US stands out for poor care coordination, safety concerns and access barriers due to cost • Shared challenges in managing transitions and chronic care • Opportunities and targets to improve care
Taking the Pulse2005 Survey of “Sicker” Adults in Six Countries • Telephone survey of sicker adults ages 18 and older in Australia, Canada, Germany, New Zealand, U.K., and U.S. • Adults met at least one of the following criteria: • Self reported health status is fair or poor • Serious illness in the past 2 years • Hospitalized or had major surgery in the past 2 years • Survey sample included 7,000 “sicker” adults: 702 Australia, 751 Canada, 1,503 Germany, 704 New Zealand, 1,770 United Kingdom, and 1,527 United States • Conducted by Harris Interactive March 2005 to June 2005 • Focus on safety, coordination, patient-physician communication and access experiences 2005 Commonwealth Fund International Health Policy Survey of Sicker Adults
Hospital Stay and Discharge Experiences • Missed opportunities to discuss risks with patients • Medication review • Care coordination and transition care at discharge
Were Risks Explained Before A Hospital Procedure in an Understandable Way? Base: Hospitalized in past 2 years Percent said risks were NOT explained 2005 Commonwealth Fund International Health Policy Survey of Sicker Adults
Failure to Discuss Medications Used Before Hospitalized on Discharge Percent of patients with new prescription who said prior medications were not reviewed at discharge 2005 Commonwealth Fund International Health Policy Survey of Sicker Adults
Deficiencies in Transition Planning When Discharged from the Hospital Base: Hospitalized in past 2 years 2005 Commonwealth Fund International Health Policy Survey of Sicker Adults
Readmitted to a Hospital or Went to ER as a Result of Complications after Discharge Base: Hospitalized in past 2 years Percent readmitted or ER visit due to complications 2005 Commonwealth Fund International Health Policy Survey of Sicker Adults
U.S. Variations in Patient-Centered Hospital Care: Staff Managed Pain, Responded When Needed Help, and Explained Medicines, 2005 Percent of patients reporting “always” * *** ** *Patient’s pain was well controlled and hospital staff did everything to help with pain **Patient got help as soon as wanted after patient pressed call button and in getting to the bathroom/using bedpan ***Hospital staff told patient what medicine was for and described possible side effects in a way that patient could understand SOURCE: 2005 CAHPS Hospital Survey results for 254 hospitals. National CAHPS Benchmarking Database
U.S. Heart Failure Patients Given Written Instructions or Educational Materials When Discharged, 2004 Percent of heart failure patients discharged home with written instructions or educational material* • Discharge instructions must address all of the following: activity level, diet, discharge medications, follow-up appointment, weight monitoring, and what to do if symptoms worsen • SOURCE: A. Jha and A. Epstein, Harvard University analysis of Hospital Quality Alliance national reporting system; State estimates – Hospital Compare database at www.hospitalcompare.hhs.gov
U.S. Hospital 30-Day Readmission Rates, Medicare Variations by State, 2003 Rate of hospital readmission within 30 days Source: G. Anderson and R. Herbert for the Commonwealth Fund, Medicare Standard Analytical File 5% 2001 data.
Coordinated Care Across Sites of Care Makes a DifferenceCare Transition Measure Scores,* Emergency Department Use, and Hospital Readmissions Emergency Department Use Hospital Readmissions p=0.01 * When I left the hospital, I had a good understanding of the things I was responsible for in managing my health; when I left the hospital, I clearly understood the purpose for taking each of my medications; The hospital staff took my preferences and those of my family or caregiver into account in deciding what my health care needs would be when I left the hospital. Source: E.A. Coleman, “Windows of Opportunity for Improving Transitional Care,” Presentation to The Commonwealth Fund Commission on a High Performance Health System, March 30, 2006.
Medical Mistake or Medication Error In Past Two Years Percent reporting either mistake or medication error 2005 Commonwealth Fund International Health Policy Survey of Sicker Adults
Medical Mistake or Medication Error Occurred Outside the Hospital Base: Experienced medical mistake or medication error Percent saying error occurred outside the hospital 2005 Commonwealth Fund International Health Policy Survey of Sicker Adults
Incorrect Lab/Diagnostic Test or Delay in Receiving Abnormal Test Results Percent reporting either lab test error in past two years 2005 Commonwealth Fund International Health Policy Survey of Sicker Adults
Any Error: Medical Mistake, Medication Error or Test Error in Past 2 Years Percent 2005 Commonwealth Fund International Health Policy Survey of Sicker Adults
Mistake Any Error By Number of Doctors Seen in Past 2 Years Percent 2005 Commonwealth Fund International Health Policy Survey of Sicker Adults
Care Coordination 2005 Commonwealth Fund International Health Policy Survey of Sicker Adults
Coordination Problems by Number of Doctors Percent *Either records/results did not reach doctors office in time for appointment OR doctors ordered a duplicate medical test 2005 Commonwealth Fund International Health Policy Survey of Sicker Adults
Prescription Medications Base: Adults with chronic disease on regular medications *Doctor only sometimes, rarely or never 2005 Commonwealth Fund International Health Policy Survey of Sicker Adults
Doctor Gives You Plan for Self-Management Base: Adults with chronic disease Percent given self-management plan 2005 Commonwealth Fund International Health Policy Survey of Sicker Adults
Doctor’s Office Has a Nurse Regularly Involved in Care Management Base: Adults with chronic disease Percent have nurse involved 2005 Commonwealth Fund International Health Policy Survey of Sicker Adults
Adults with Diabetes Who Received Recommended Care, by Self-Management Plan or Nurse Involvement Includes Hemoglobin A1C and cholesterol checked, and feet and eyes examined 2005 Commonwealth Fund International Health Policy Survey of Sicker Adults
Cost-Related Access Problems 2005 Commonwealth Fund International Health Policy Survey of Sicker Adults
Out-of-Pocket Medical Costs in the Past Year Percent AUS CAN GER NZ UK US AUS CAN GER NZ UK US 2005 Commonwealth Fund International Health Policy Survey of Sicker Adults
Waiting Time to See Doctor When Sick or Need Medical Attention, Sicker Adults in Six Countries, 2005 Last time you were sick or needed medical attention, how quickly could you get an appointment to see a doctor? Percent of adults SOURCE: 2005 Commonwealth Fund International Health Policy Survey of Sicker Adults (Schoen et al. Taking the Pulse of Health Systems, Health Affairs November 2005)
Difficulty Getting Care on Nights, Weekends, Holidays Without Going to The ER Percent Saying “Very” or “Somewhat Difficult” 2005 Commonwealth Fund International Health Policy Survey of Sicker Adults
Went to the ER for Condition that Could Have Been Treated by Regular Doctor if Available Percent 2005 Commonwealth Fund International Health Policy Survey of Sicker Adults
THE COMMONWEALTH FUND International View Summary • U.S. an outlier on cost barriers with evidence of poorly coordinated fragmented care, lack of primary care access • Medical Errors: High rates in multiple areas • Patients reported errors occur outside the hospital • Shared challenges across countries • Coordination: Failures to coordinate well across sites of care, especially during transitions • Chronic Care: Gaps in engaging patients and use of teams to help manage care • Opportunities to learn from exchange
US Health Care System - Trends • Markedly higher health care expenditures but variable performance in international comparisons • Wide variations in quality and costs • Access of increasing concern • Fragmented insurance and care systems • Uninsured and underinsured • Need to improve Access, Quality and Efficiency
International Comparison of Spending on Health, 1980–2004 Average spending on health per capita ($US PPP) Total expenditures on health as % GDP Source: OECD Health Data 2005 and 2006
1999–2000 2003–2004 NH NH ME WA NH VT ME WA VT ND MT ND MT MN MN OR NY MA WI OR MA NY ID SD WI RI MI ID SD RI WY MI CT PA WY NJ CT IA PA NJ NE IA OH DE IN NE OH NV DE IN IL MD NV WV UT VA IL MD CO DC WV UT VA KS MO KY CA CO DC KS MO KY CA NC NC TN TN OK SC AR OK AZ NM SC AR AZ NM MS GA AL MS GA AL TX LA TX LA FL FL AK AK 23% or more HI HI 19%–22.9% 14%–18.9% Less than 14% Percent of Adults Ages 18–64 Uninsured by State SOURCE: Two-year averages 1999–2000 and 2003–2004 from the Census Bureau’s March 2000, 2001 and 2004, 2005 Current Population Surveys. Estimates by the Employee Benefit Research Institute.
46 Million Uninsured in 2004; Increasing Steadily Since 2000 Millions uninsured 46 2013 Projected *1999–2003 estimates reflect the results of follow-up verification questions and implementation of Census 2000-based population controls. Note: Projected estimates for 2004–2013 are for nonelderly uninsured based on T. Gilmer and R. Kronick, “It’s the Premiums, Stupid: Projections of the Uninsured Through 2013,” Health Affairs Web Exclusive, April 5, 2005. Source: U.S. Census Bureau, March CPS Surveys 1988 to 2005.
U.S. Adults Without Insurance Are Less Likely to Be Able to Manage Chronic Conditions Percent of adults ages 19–64 with at least one chronic condition* * Hypertension, high blood pressure, or stroke; heart attack or heart disease; diabetes; asthma, emphysema, or lung disease. Source: The Commonwealth Fund Biennial Health Insurance Survey (2005).
“Underinsured” and Uninsured Adults Experience High Rates of Access Problems and Financial Stress Percent adults 19-64, 2003 * Did not fill a prescription; did not see a specialist; skipped recommended care; or did not see doctor when sick because of costs. Source: C. Schoen, et al., “Insured but Not Protected: How Many Adults Are Underinsured?” Health Affairs Web Exclusive, June 14, 2005.
Cost-Sharing Reduces Use of Both Essential and Less Essential Drugs and Increases Risk of Adverse Events Percent reduction in drugs per day Percent increase in incidence per 10,000 Source: R. Tamblyn et al., “Adverse Events Associated With Prescription Drug Cost-Sharing Among Poor and Elderly Person,” JAMA 285, no. 4 (2001): 421–429.
Inadequate Clinical Information SystemsU.S. Doctors Electronic Access to Test Results, Medical Records and Electronic Ordering Percent who “routinely/occasionally” use the following: * Electronic ordering of tests, procedures, or drugs. Source: A. Audet, M. Doty, J. Peugh et al., “Information Technologies: When Will They Make It Into Physicians' Black Bags?” Medscape General Medicine, December 7, 2004.
Quality and Medicare Spending VaryAcross U.S. States, 2000–2001 Sources: K. Baicker and A. Chandra, “Medicare Spending, The Physician Workforce, and Beneficiaries’ Quality of Care,” Health Affairs Web Exclusive, April 7, 2004.
Take Away Messages • We should expect more given the resources committed to health care. • Coordination is a key aspect of safety and effective care • This includes across sites of care • Unacceptably wide variation in the quality and cost of care – patient experiences as well as clinical indicators provide targets for improvement • Information technology -- lagging behind • Re-design toward more integrated care, with evidence based practice goals • Insurance and access are essential for improving quality and safety • Physician leadership is critical
THE COMMONWEALTH FUND Acknowledgements With appreciation to: • Co-Authors: Robin Osborn, Phuong Trang Huynh, Michelle Doty, Kinga Zapert, Jordan Peugh and Karen Davis • For 2005 Six Country of Sicker Adults and 2004 Five Country Survey of Primary Care All Adults see: • Schoen et al. “Taking the Pulse of Health Care Systems: Experiences of Patients with Health Problems in Six Countries, Health Affairs, November 3, 2005 • Schoen et al. “ Primary Care and Health System Performance: Adults’ Experiences in Five Countries” Health Affairs October 28, 2004. • For international and national studies on U.S. quality and care Visit the Fund at: www.cmwf.org