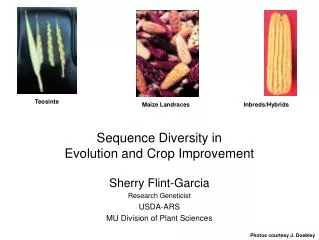
Sequence Evolution
Explore mutations, natural selection, and evolutionary analyses to understand how genetic variations shape the survival of mutations over time in populations.

Sequence Evolution
E N D
Presentation Transcript
Sequence Evolution What are mutations and what do they tell us about evolution? What is recombination and how can it be factored into evolutionary analyses? Analysing natural selection
Different types of mutation 4 types of mutant Harmful Neutral Conditionally useful Useful Potentially useful mutations may have no immediate value and might only be beneficial under certain circumstances Most non-neutral mutations will be harmful Useful mutations will occur in genomes that contain mutations that are harmful.
The survival of mutations more common Frequency of a mutation in the population less common Time since the mutation arose Consider how we would analyse natural selection in these sequences if we could only sample populations at one or a few time-points
The survival of mutations more common 5 3 4 6 Frequency of a mutation in the population 1 7 8 2 9 less common Time since the mutation arose To make things simple we’ll only consider a situation where 9 sites have varied
The survival of mutations more common 5 3 4 6 Frequency of a mutation in the population 1 7 8 2 9 less common Time since the mutation arose To make things even simpler we’ll pretend that all sequences begin as a sting of A’s AAAAAAAAA
The survival of mutations 0 1 2 more common 5 3 4 6 Frequency of a mutation in the population 1 7 8 2 9 less common Time since the mutation arose AAAAAAAAA AAAAAAAAA AAAAAAAAA AAAAAAAAA AAAAAAAAA If we sampled 5 sequences at time-point 0 we would get this alignment
The survival of mutations 0 1 2 more common 5 3 4 6 Frequency of a mutation in the population 1 7 8 2 9 less common Time since the mutation arose AAAAGAAAG AAGAGAAAA GAGAGGAAA AAAAGAAAA AAGAGGAGA AAAAAAAAA AAAAAAAAA AAAAAAAAA AAAAAAAAA AAAAAAAAA If we sampled again at time-point 1 we would get this
The survival of mutations 0 1 2 more common 5 3 4 6 Frequency of a mutation in the population 1 7 8 2 9 less common Time since the mutation arose AAAAGAAAG AAGAGAAAA GAGAGGAAA AAAAGAAAA AAGAGGAGA AGGGGAAAA GAGGGGAAA AAGAGGAAA GAGGGGAAA AAGGGGAAA AAAAAAAAA AAAAAAAAA AAAAAAAAA AAAAAAAAA AAAAAAAAA If we sampled again at time-point 2 we would get this
The survival of mutations AAAAGAAAG AAGAGAAAA GAGAGGAAA AAAAGAAAA AAGAGGAGA AGGGGAAAA GAGGGGAAA AAGAGGAAA GAGGGGAAA AAGGGGAAA AAAAAAAAA AAAAAAAAA AAAAAAAAA AAAAAAAAA AAAAAAAAA • If we were able to track this process (as is possible for some rapidly evolving viruses like HIV) we could speculate: • Mutations at sites1, 3, 4, 5 and 6 were either neutral or adaptive – i.e. the mutant allele rises in frequency and sometimes becomes fixed.
The survival of mutations AAAAGAAAG AAGAGAAAA GAGAGGAAA AAAAGAAAA AAGAGGAGA AGGGGAAAA GAGGGGAAA AAGAGGAAA GAGGGGAAA AAGGGGAAA AAAAAAAAA AAAAAAAAA AAAAAAAAA AAAAAAAAA AAAAAAAAA • If we were able to track this process (as is possible for some rapidly evolving viruses like HIV) we could speculate: • Mutations at sites1, 3, 4, 5 and 6 were either neutral or adaptive • Mutations at sites 8 and 9 were either neutral or harmful - i.e. the mutant alleles arise but are then lost/decrease in frequency below the detection threshold
The survival of mutations AAAAGAAAG AAGAGAAAA GAGAGGAAA AAAAGAAAA AAGAGGAGA AGGGGAAAA GAGGGGAAA AAGAGGAAA GAGGGGAAA AAGGGGAAA AAAAAAAAA AAAAAAAAA AAAAAAAAA AAAAAAAAA AAAAAAAAA • If we were able to track this process (as is possible for some rapidly evolving viruses like HIV) we could speculate: • Mutations at sites1, 3, 4, 5 and 6 were either neutral or adaptive • Mutations at sites 8 and 9 were either neutral or harmful • Sites 2, 7, 8 and 9 are evolving under negative/purifying selection – i.e. the wild-type allele is the best there is since all observed non-wt alleles only ever occur at low frequencies and/or are lost.
The survival of mutations AAAAGAAAG AAGAGAAAA GAGAGGAAA AAAAGAAAA AAGAGGAGA AGGGGAAAA GAGGGGAAA AAGAGGAAA GAGGGGAAA AAGGGGAAA AAAAAAAAA AAAAAAAAA AAAAAAAAA AAAAAAAAA AAAAAAAAA • If we were able to track this process (as is possible for some rapidly evolving viruses like HIV) we could speculate: • Mutations at sites1, 3, 4, 5 and 6 were either neutral or adaptive • Mutations at sites 8 and 9 were either neutral or harmful • Sites 2, 7, 8 and 9 are evolving under negative/purifying selection • Sites 3,4,5 and 6 are evolving under positive/diversifying selection – i.e. mutant alleles displace wt alleles.
The survival of mutations AAAAGAAAG AAGAGAAAA GAGAGGAAA AAAAGAAAA AAGAGGAGA AGGGGAAAA GAGGGGAAA AAGAGGAAA GAGGGGAAA AAGGGGAAA AAAAAAAAA AAAAAAAAA AAAAAAAAA AAAAAAAAA AAAAAAAAA • If we were able to track this process (as is possible for some rapidly evolving viruses like HIV) we could speculate: • Mutations at sites1, 3, 4, 5 and 6 were either neutral or adaptive • Mutations at sites 8 and 9 were either neutral or harmful • Sites 2, 7, 8 and 9 are evolving under negative/purifying selection • Sites 3,4,5 and 6 are evolving under positive/diversifying selection • Site 1 is evolving either neutrally or under weak positive selection.
The survival of mutations AAAAGAAAG AAGAGAAAA GAGAGGAAA AAAAGAAAA AAGAGGAGA AGGGGAAAA GAGGGGAAA AAGAGGAAA GAGGGGAAA AAGGGGAAA AAAAAAAAA AAAAAAAAA AAAAAAAAA AAAAAAAAA AAAAAAAAA • If we were able to track this process (as is possible for some rapidly evolving viruses like HIV) we could infer: • Mutations at sites1, 3, 4, 5 and 6 were either neutral or adaptive • Mutations at sites 8 and 9 were either neutral or harmful • Sites 2, 7, 8 and 9 are evolving under negative/purifying selection • Sites 3,4,5 and 6 are evolving under positive/diversifying selection • Site 1 is evolving either neutrally or under weak positive selection. Although quite powerful this experimental approach highlights a problem with inferance: It is sometimes wrong
Detecting selection in reality AGGGGAAAA GAGGGGAAA AAGAGGAAA GAGGGGAAA AAGGGGAAA In reality for most organisms often effectively only a single sampling time-point is available –We cannot go back thousands of years and take population samples
Detecting selection in reality AGGGGAAAA GAGGGGAAA AAGAGGAAA GAGGGGAAA AAGGGGAAA • Just from looking at this one time-point we can infer: • Invariant sites like 3, 5, 7, 8 and 9 are evolving under negative selection – i.e. the current alleles at these sites are better than any mutants that might arise. How can this be? Previously we saw that sites 3 and 5 had evolved under positive selection
Detecting selection in reality AGGGGAAAA GAGGGGAAA AAGAGGAAA GAGGGGAAA AAGGGGAAA • Just from looking at this one time-point we can infer: • Invariant sites like 3, 5, 7, 8 and 9 are evolving under negative selection – i.e. the current alleles at these sites are better than any mutants that might arise. Remember that every current wild-type allele that is evolving under negative selection was once a mutant allele that was driven to fixation by positive selection
Detecting selection in reality AGGGGAAAA GAGGGGAAA AAGAGGAAA GAGGGGAAA AAGGGGAAA • Just from looking at this one time-point we can infer: • Invariant sites like 3, 5, 7, 8 and 9 are evolving under negative selection – i.e. the current alleles at these sites are better than any mutants that might subsequently arise. Despite their names negative selection and positive selection are not opposites – they are different aspects of the same process: Natural selection
Detecting selection in reality AGGGGAAAA GAGGGGAAA AAGAGGAAA GAGGGGAAA AAGGGGAAA • Just from looking at this one time-point we can infer: • Invariant sites like 3, 5, 7, 8 and 9 are evolving under negative selection • Sites like 1 with intermediate frequency alleles are evolving under positive selection, neutral genetic drift or balancing selection These are very difficult to distinguish from data taken at a single time-point.
Detecting selection in reality AGGGGAAAA GAGGGGAAA AAGAGGAAA GAGGGGAAA AAGGGGAAA • Just from looking at this one time-point we can infer: • Invariant sites like 3, 5, 7, 8 and 9 are evolving under negative selection • Sites like 1 with intermediate frequency alleles are evolving under positive selection, neutral genetic drift or balancing selection • Sites like 2, 4 and 6 that have low frequency polymorphisms are potentially evolving under weak purifying selection that favors the higher frequency allele , neutral genetic drift or balancing selection Again, these are very difficult to distinguish from data taken at a single time-point.
Detecting selection in reality AGGGGAAAA GAGGGGAAA AAGAGGAAA GAGGGGAAA AAGGGGAAA • Just from looking at this one time-point we can infer: • Invariant sites like 3, 5, 7, 8 and 9 are evolving under negative selection • Sites like 1 with intermediate frequency alleles are evolving under positive selection, neutral genetic drift or balancing selection • Sites like 2, 4 and 6 that have low frequency polymorphisms are potentially evolving under weak purifying selection that favors the higher frequency allele , neutral genetic drift or balancing selection It is, however, possible to reliably detect selection if we look at the alignment as a whole.
Summary statistics of selection Various different methods test whole alignments for the relative ratios of low and intermediate frequency alleles. AGGGGAAAA GAGGGGAAA AAGAGGAAA GAGGGGAAA AAGGGGAAA
Summary statistics of selection Various different methods test whole alignments for the relative ratios of low and intermediate frequency minor alleles. eg in this alignment there is one intermediate frequency minor allele (the “G” at site 1) and three low frequency minor alleles (the “G” at site 2, and the “A”’s at sites 4 and 6). Note here we have taken 0.2 or lower to be low frequency and 0.2-0.5 to be intermediate frequency. AGGGGAAAA GAGGGGAAA AAGAGGAAA GAGGGGAAA AAGGGGAAA
Summary statistics of selection Various different methods test whole alignments for the relative ratios of low and intermediate frequency minor alleles. The predominance of sites with low frequency minor alleles relative to sites with intermediate frequency minor alleles in this alignment implies a predominance of negative/purifying selection or the occurrence of a selective sweep that wiped out much of the diversity in this population of sequences AGGGGAAAA GAGGGGAAA AAGAGGAAA GAGGGGAAA AAGGGGAAA
Summary statistics of selection Various different methods test whole alignments for the relative ratios of low and intermediate frequency minor alleles. If conversely these was a predominance of sites with intermediate frequency minor alleles it would imply a predominance of neutral genetic drift, balancing selection or positive selection during the evolution of these sequences AGGGGAAAA GAGGGGAAA AAGAGGAAA GAGGGGAAA AAGGGGAAA
Summary statistics of selection Various different methods test whole alignments for the relative ratios of low and intermediate frequency minor alleles. The most popular “summary statistic” selection detection methods are: Fu and Li’s F test Tajima's D test McDonald-Kreitman test All are implemented in the program DNASP AGGGGAAAA GAGGGGAAA AAGAGGAAA GAGGGGAAA AAGGGGAAA
Summary statistics of selection Various different methods test whole alignments for the relative ratios of low and intermediate frequency minor alleles. The most popular “summary statistic” selection detection methods are: Fu and Li’s F test Tajima's D test McDonald-Kreitman test These tests yield a summary statistic – essentially a number with either a negative or positive value. AGGGGAAAA GAGGGGAAA AAGAGGAAA GAGGGGAAA AAGGGGAAA
Summary statistics of selection Various different methods test whole alignments for the relative ratios of low and intermediate frequency minor alleles. The most popular “summary statistic” selection detection methods (all implemented in the program DNASP) are: Fu and Li’s F test Tajima's D test McDonald-Kreitman test A significantly negative score implies purifying/negative selection and a significantly positive score implies positive/diversifying selection. AGGGGAAAA GAGGGGAAA AAGAGGAAA GAGGGGAAA AAGGGGAAA
Summary statistics of selection Various different methods test whole alignments for the relative ratios of low and intermediate frequency minor alleles. The most popular “summary statistic” selection detection methods are: Fu and Li’s F test Tajima's D test McDonald-Kreitman test Importantly, these tests can be very easily confounded (i.e. messed up) by non-random sampling, population subdivisions, and population growth. AGGGGAAAA GAGGGGAAA AAGAGGAAA GAGGGGAAA AAGGGGAAA
dN/dS based selection analysis It is also possible to detect selection acting on protein coding regions The basis of these tests is that each amino acid is encoded by more than one codon
dN/dS based selection analysis It is also possible to detect selection acting on protein coding regions Some nucleotide substitutions within coding regions will be “silent” in that they will not result in an amino acid change
dN/dS based selection analysis Eg Consider the Leucine encoding codon CUG 6 different codons encode leucine
dN/dS based selection analysis Eg Consider the Leucine encoding codon CUG 1 2 3 AUG met CAG gln CUA leu CUG leu CCG pro GUG val CUC leu UUG leu CGG arg CUU leu 4/9 single nucleotide substitutions within this codon will yield a different codon that still encodes leucine (i.e. the mutations will be silent or synonymous)
dN/dS based selection analysis Eg Consider the Leucine encoding codon CUG Mutations at position 1 2 3 AUG met CAG gln CUA leu CUG leu CCG pro GUG val CUC leu UUG leu CGG arg CUU leu 5/9single nucleotide substitutions within this codonwill result in an amino acid substitution (i.e. the mutations will be non-synonymous)
dN/dS based selection analysis Eg Consider the Leucine encoding codon CUG Mutations at position 1 2 3 AUG met CAG gln CUA leu CUG leu CCG pro GUG val CUC leu UUG leu CGG arg CUU leu For any gene there are ~2-3 times more possible non-synonymous substitutions than there are synonymous substitutions
dN/dS based selection analysis Eg Consider the Leucine encoding codon CUG Mutations at position 1 2 3 AUG met CAG gln CUA leu CUG leu CCG pro GUG val CUC leu UUG leu CGG arg CUU leu To compare rates of synonymous and non-synonymous substitution it is necessary to use normalised rates of each
dN/dS based selection analysis Eg Consider the Leucine encoding codon CUG Mutations at position 1 2 3 AUG met CAG gln CUA leu CUG leu CCG pro GUG val CUC leu UUG leu CGG arg CUU leu dS = normalised synonymous substitution rate = the observed number of synonymous substitutions divided by the expected number
dN/dS based selection analysis Eg Consider the Leucine encoding codon CUG Mutations at position 1 2 3 AUG met CAG gln CUA leu CUG leu CCG pro GUG val CUC leu UUG leu CGG arg CUU leu dN = normalised non-synonymous substitution rate = the observed number of non-synonymous substitutions divided by the expected number
dN/dS based selection analysis To work dN/dS out for a group of sequences we must first draw a tree 1 AUA 2 CUA 3 CUU UUA 4 5 UUG
dN/dS based selection analysis Then we identify the synonymous andnon-synonymous mutations 1 AUA CUA 2 CUA CUA 3 CUU CUG UUA 4 UUG 5 UUG
dN/dS based selection analysis In this example we have 4 synonymous mutations and 1 non-synonymous mutation 1 AUA CUA 2 CUA CUA 3 CUU CUG UUA 4 UUG 5 UUG
dN/dS based selection analysis Given 5 mutations, under neutral conditions, we expect (4/9)*5 = 2.2 to be synonymous and (5/9)*5 = 2.8 to be non synonymous 1 AUA CUA 2 CUA CUA 3 CUU CUG UUA 4 UUG 5 UUG Note the “4/9” and “5/9” numbers given above are specific to the CUG codon – other codons have their own proportions of synonymous and non-synonymous mutations – To simplify things here I’ve just pretended that they all the same as CUG
dN/dS based selection analysis Given 5 mutations, under neutral conditions, we expect (4/9)*5 = 2.2 to be synonymous and (5/9)*5 = 2.8 to be non synonymous 1 AUA CUA 2 CUA CUA 3 CUU CUG UUA 4 UUG 5 UUG e.g. for the isoleucine codon AUA 2/9 of the mutations are synonymous and 7/9 are non-synonymous
dN/dS based selection analysis dS = 4/2.2 = 1.82 dN = 1/2.8 = 0.36 dN/dS = 0.36/1.82 = 0.198 1 AUA (a change from leu to ile) CUA 2 CUA CUA 3 CUU CUG UUA 4 UUG 5 UUG
dN/dS based selection analysis dN/dS = 0.36/1.82 = 0.198 dN-dS = 0.36 – 1.82 = -1.46 Implies strong purifying/negative selection 1 AUA (a change from leu to ile) CUA 2 CUA CUA 3 CUU CUG UUA 4 UUG 5 UUG
dN/dS based selection analysis dN/dS = 0.36/1.82 = 0.198 dN-dS = 0.36 – 1.82 = -1.46 Implies strong purifying/negative selection 1 AUA (a change from leu to ile) CUA 2 CUA CUA 3 CUU CUG UUA 4 UUG 5 UUG dN/dS or dN-dS can be calculated for whole genes or for individual sites within genes
Programs for analysing dN/dS Mega MrBayes CodeML Hyphy DataMonkey
Programs for analysing dN/dS Mega – Maximum likelihood estimation dN/dS and can handle site-by-site estimates CodeML MrBayes Hyphy DataMonkey
Programs for analysing dN/dS Mega – Maximum likelihood estimation dN/dS and can handle site-by-site estimates CodeML – Maximum likelihood estimation dN/dS and can handle site-by-site estimates MrBayes Hyphy DataMonkey
Programs for analysing dN/dS Mega CodeML MrBayes Hyphy DataMonkey Bayesian/ML estimation dN/dS and can handle site-by-site estimates