Download
1 / 21
210 likes | 241 Vues
Learn to find rates of change and identify linear relationships in mathematical contexts, such as dog weights and student populations.

E N D
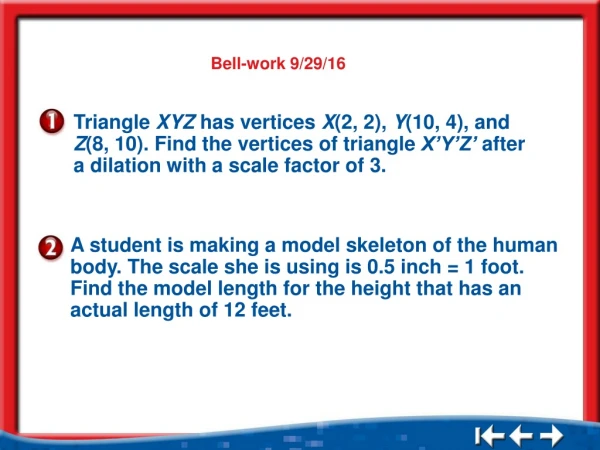
Bell-work 9/29/16 • A • B • C • D Triangle XYZ has vertices X(2, 2), Y(10, 4), and Z(8, 10). Find the vertices of triangle X’Y’Z’ after a dilation with a scale factor of 3. A student is making a model skeleton of the human body. The scale she is using is 0.5 inch = 1 foot. Find the model length for the height that has an actual length of 12 feet. 5Min 7-3
Find rates of change. • rate of change Lesson 9 MI/Vocab
Find a Positive Rate of Change DOGSThe table below shows the weight of a dog in pounds between 4 and 12 months old. Use the information in the table to find the rate of change in the dog’s weight between 8 and 12 months of age. Lesson 9 Ex1
Find a Positive Rate of Change The dog grew from 28 to 43 pounds from ages 8 to 12 months. Subtract to find the change in weights and ages. Express this rate as a unit rate. Answer: The dog grew an average of 3.75 pounds per month. Lesson 9 Ex1
HEIGHTSThe table below shows Julia’s height in inches between the ages of 6 and 11. Find the rate of change in her height between ages 6 and 9. • A • B • C • D A. 2 inches per year B. 2.2 inches per year C. 2.5 inches per year D. 3 inches per year Lesson 9 CYP1
Find a Negative Rate of Change SCHOOLSThe graph shows the number of students in the eighth grade between 2000 and 2004. Find the rate of change between 2002 and 2004. Lesson 9 Ex2
Find a Negative Rate of Change Use the data to write a rate comparing the change in students to the change in time. The number of students changed from 485 to 459 from 2002 to 2004. Simplify. Express as a unit rate. Lesson 9 Ex2
Find a Negative Rate of Change Answer: The rate of change is –13 students per year. The rate is negative because between 2000 and 2002, the number of students decreased. This is shown on the graph by a line slanting downward from left to right. Lesson 9 Ex2
Identify proportional and nonproportional linear relationships by finding a constant rate of change. • linear relationship • constant rate of change Lesson 10 MI/Vocab
Identify Linear Relationships BABYSITTINGThe amount a babysitter charges is shown. Is the relationship between the number of hours and the amount charged linear? If so, find the constant rate of change. If not, explain your reasoning. Lesson 10 Ex1
Identify Linear Relationships Examine the change in the number of hours worked and in the amount earned. Lesson 10 Ex1
BABYSITTINGThe amount a babysitter charges is shown. Is the relationship between the number of hours and the amount charged linear? If so, find the constant rate of change. • A • B • C • D Lesson 10 CYP1
Find a Constant Rate of Change TRAVELFind the constant rate of change for the hours traveled and miles traveled. Interpret its meaning. Choose any two points on the line and find the rate of change between them. Lesson 10 Ex2
Find a Constant Rate of Change The amount of miles changed from 60 to 120 between hours 2 and 4. Subtract to find the change in miles and the change in time. Express this rate as a unit rate. Answer: The rate of speed is 30 miles per hour. Lesson 10 Ex2
TRAVELFind the constant rate of change for the hours traveled and miles traveled. Interpret its meaning. • A • B • C • D A. The rate of speed is20 miles per hour. B. The rate of speed is 25 miles per hour. C. The rate of speed is 40 miles per hour. D. The rate of speed is 50 miles per hour. Lesson 10 CYP2
Identify Proportional Relationships TAXISUse the graph to determine if there is a proportional linear relationship between the miles driven and the charge for a ride. Explain your reasoning. Since the graph of the data forms a line, the relationship between the two scales is linear. This can also be seen in the table of values created using the points on the graph. Lesson 10 Ex3
Identify Proportional Relationships To determine if the two scales are proportional, express the relationship between the charges for several miles as a ratio. Answer: Since the ratios are not all the same, the total charge is not proportional to the number of miles driven. Lesson 10 Ex3
MOVIESUse the graph to determine if there is a proportional linear relationship between the number of movies rented and the total cost. Explain your reasoning. • A • B A.The data lie in a straight line and the ratio of the number of movies rented to the total cost is always the same, so there is a proportional linear relationship. B.The data lie in a straight line but the ratio of the number of movies rented to the total cost is not always the same, so there is not a proportional linear relationship. Lesson 10 CYP3