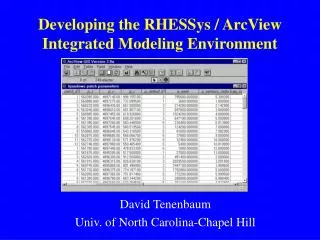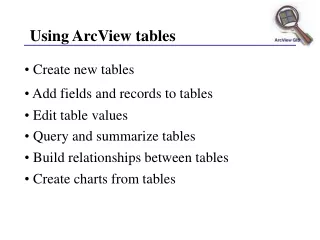
Watershed Modeling Using ArcView
Watershed Modeling Using ArcView. Timothy N. Loesch 2000 Minnesota GIS/LIS Consortium. Watershed Modeling Workshop. Welcomes and Introductions Who the heck am I? Work in the DNR MIS Bureau - GIS Section First involved in GIS in 1985 Interest in Education, Programming and Hydro


Watershed Modeling Using ArcView
E N D
Presentation Transcript
Watershed Modeling Using ArcView Timothy N. Loesch 2000 Minnesota GIS/LIS Consortium
Watershed Modeling Workshop • Welcomes and Introductions • Who the heck am I? • Work in the DNR MIS Bureau - GIS Section • First involved in GIS in 1985 • Interest in Education, Programming and Hydro • e-mail - tim.loesch@dnr.state.mn.us • Who the heck are you? • Name, Rank & Serial number • Background Bio Information... • ArcView Experience? Minnesota GIS/LIS Consortium Spring Workshops 2000’
Watershed Modeling Workshop • Class Content • Overview Hydrologic Modeling Process in GIS • Overview of Digital Elevation Models • Explanation of Processes and Procedures • Attributes Derived from DEMs • Implementation in ArcView Minnesota GIS/LIS Consortium Spring Workshops 2000’
Watershed Modeling Workshop • Class Timetable/Agenda • 9:00 - 9:15 - Welcome and Introduction • 9:15 - 10:00 - Hydrologic Modeling in GIS • Description of terms • Discussion of Digital Elevation Models (DEM) • 10:00 - 10:15 - Preprocessing DEMs • Filling Sinks • Determining Sink Depth Minnesota GIS/LIS Consortium Spring Workshops 2000’
Watershed Modeling Workshop • Class Timetable/Agenda • 10:15 - 10:30 - Break! • 10:30 - 11:30 - Surface Parameters • Flow Direction • Flow Accumulation • Flow Length • 11:15 - 12:15 - Delineate Watersheds • Delineation of Contributing Areas • Delineation of Watersheds and Basins • Summarizing Watershed Parameters Minnesota GIS/LIS Consortium Spring Workshops 2000’
Watershed Modeling Workshop • Class Timetable/Agenda • 12:15 - 12:45 - Lunch • 12:45 - 2:30 - Map Overlay and Predictive Equations • 2:30 - 2:45 - Break • 2:45 - 4:00 - Extending the Hydrologic Model in 3D • 4:00 Wrap-up and questions…. Minnesota GIS/LIS Consortium Spring Workshops 2000’
Watershed Modeling Workshop • Hydrologic Modeling in GIS • The Shape and characteristics of the earth’s surface is useful for many fields of study. • Understanding how changes in the composition of an area will affect water flow is important! • What happens when residential development occurs? • How does this affect the watershed? • How can these affects be mitigated? • Best management Practices Minnesota GIS/LIS Consortium Spring Workshops 2000’
Watershed Modeling Workshop Minnesota GIS/LIS Consortium Spring Workshops 2000’
Watershed Modeling Workshop Topographic Maps Minnesota GIS/LIS Consortium Spring Workshops 2000’
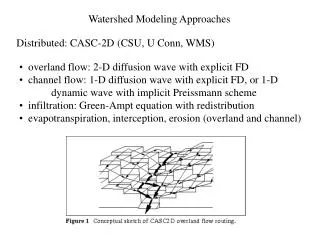
Outlet Point Watershed Modeling Workshop Traditional watershed delineation has been done manually using contours on a topographic map. A watershed boundary can be sketched by starting at the outlet point and following the height of land defining the drainage divides using the contours on a map. Minnesota GIS/LIS Consortium Spring Workshops 2000’
Watershed Modeling Workshop • Drainage system - The area upon which water falls and the network through which it travels to an outlet. • Drainage Basin - an area that drains water and other substances to a common outlet as concentrated flow (watersheds, basins, catchments, contributing area) • Subbasin - That upstream area flowing to an outlet as overland flow • Pour Point - A location at which the contributing area can be determined. • Drainage Divide - The boundary between two basins. This is an area of divergent flow. Minnesota GIS/LIS Consortium Spring Workshops 2000’
Watershed Modeling Workshop • Stream Network A stream network is composed of those areas where concentrated flow is occurring. • Stream Ordering • Shreve - When two links intersect, their magnitudes are added and assigned to the downslope link. • Strahler - Stream order only increases when streams of the same order intersect Minnesota GIS/LIS Consortium Spring Workshops 2000’
Watershed Modeling Workshop • Curvature - Curvature quantifies the shape of the surface to understand erosion and drainage process • convex (bulging) • concave (bowing) • Profile Curvature - Curvature of a surface in the direction of slope. • Concave - slow flow and deposition • Convex - Increasing slopes and erosion • Planform Curvature - Curvature of a surface perpendicular to direction of slope • Convex - Divergent flow indicating ridges • Concave - Convergent flow indicates valleys Minnesota GIS/LIS Consortium Spring Workshops 2000’
Watershed Modeling Workshop • Raster Data Structure • Much of the data we will use in this class will be “Raster” data. • Raster formatted data is much more suitable for many types of landscape modeling, including hydrologic analysis. • Inputs such as elevation can only be processed as a raster data set • Raster is Faster, Vector is Corrector Minnesota GIS/LIS Consortium Spring Workshops 2000’
Watershed Modeling Workshop Raster Vector Real World Minnesota GIS/LIS Consortium Spring Workshops 2000’
Most Raster data is created by Rasterizing existing Vector data Transparent grid is placed on map. Each cell is assigned a numeric value according to the dominate attribute type found in cell. Integer and Real values are valid Watershed Modeling Workshop Minnesota GIS/LIS Consortium Spring Workshops 2000’
Watershed Modeling Workshop • Digital Elevation Models (DEM) • To do all of this stuff you need data. • A DEM is a digital representation of the elevation of a land surface. • X,Y and Z value • The USGS is the major producer of DEM’s in the Nation Minnesota GIS/LIS Consortium Spring Workshops 2000’
Watershed Modeling Workshop • DEM’s consist of an array of data representing elevation sampled at regularly spaced intervals Y ELEVATION VALUES X Minnesota GIS/LIS Consortium Spring Workshops 2000’
Watershed Modeling Workshop The elevation values of the DEM can be grouped into intervals. Each interval is then represented by a different gradient color. Minnesota GIS/LIS Consortium Spring Workshops 2000’
Watershed Modeling Workshop • Two Scales of DEMs Available for Minnesota • 1:24,000 Scale • Level 1 - 30 meter spacing • Errors up to 15 meters inherent in data • Developed using automated methods from air photos • Systematic errors evident as banding • Not appropriate for hydrologic modeling • Level 2 • Matches map accuracy of 1:24,000 scale quads • Developed by scanning published quads • Appropriate for hydrologic modeling • 1 Degree (~250,000) scale - 93 meter spacing • Appropriate for regional analysis Minnesota GIS/LIS Consortium Spring Workshops 2000’
Watershed Modeling Workshop Metro Area done by the Met Council For more information look at: http://www.lmic.state.mn.us/bmap90/dem/dem.htm Minnesota GIS/LIS Consortium Spring Workshops 2000’
Watershed Modeling Workshop ArcView Exercise #1 - Viewing DEMs 1) Start ArcView by clicking on the ArcView Icon on the desktop that says HYDROMOD.APR 2) This opens an ArcView Project that we will be working in for the remainder of this workshop. It has the Spatial Analyst Extension Loaded and a couple of predefined Views and Themes. 3) Open the View called Digital Elevation Model. 4) This View contains a digital elevation model (DEM) for a small (7400 acres) watershed in Rice county Minnesota. This View contains 4 themes: Watershed Basin - Watershed delineated in 1995 Roads and Highways - From MNDOT Streams and Ditches - Digitized from USGS Digital Raster Graphics (DRGS) Original DEM - A hydrologically adjusted 1:24,000 scale Level 2 DEM from the USGS with a cell resolution of 10 meters. 5) Since we want all of this to be bounded by the incredible graphics you can create using GIS let’s start by creating a Hill-shaded view of the Original DEM Theme. To do this make the “Original DEM” theme active and then accessing the Compute Hillshade option in the SURFACE menu. Accept the default values of Azimuth and Altitude, then press OK to generate the grid. Once it’s done processing a new theme will be added to the view called “Hillshade of Original DEM”. Turn it on and view it. It’s a pseudo-3D perspective based on a light source in the upper left. Then Turn it off. Now hide the legend of this theme by making it active and then using the THEME menu, Hide/Show Legend option. Minnesota GIS/LIS Consortium Spring Workshops 2000’
Watershed Modeling Workshop ArcView Exercise #1 - Viewing DEMs 6) We can now use the hillshade theme to act as a brightness theme for our elevation. To do this access the legend editor for the “Original DEM” theme. Then press the Advanced button in the lower left hand corner of the Legend Editor dialog. Fill out this dialog as it appears to the right. Then press the OK button and Apply the legend. NICE HUH?! 7) Turn on the other themes in your view (Roads and Highways, Streams and Ditches, and Watersheds). This shaded relief view is really a great way to view data. It adds a nice perspective to the landscape and when the watersheds and streams are displayed you can do some valuable visual analysis and interpretation. 8) Now add a couple more themes. There are two images in the C:\HYDROMOD subdirectory that you should add to this View. One is a Digital Orthophoto Quadrangle (DOQ.TIF) and one is a scanned 1:24,000 USGS quadrangle map called a Digital Raster Graphic or DRG (DRG.TIF). To add these to your View document use the VIEW menu, Add Theme option. Make sure you set the Data Source Type selection to IMAGE. Select the two images and then press the OK button. Minnesota GIS/LIS Consortium Spring Workshops 2000’
Watershed Modeling Workshop ArcView Exercise #1 - Viewing DEMs 9)Edit the property sheets of these images by making them active and using the THEME menu, Properties option. Set the name of the DOQ to “Digital Ortho Photograph” and the name of the DRG to “Digital Raster Graphic”. 10) Then re-order these themes so that the Digital Ortho Photo theme is on the bottom of the table of contents and the Digital Raster Graphic theme is on the top. 11) Edit the legend of the Digital Raster Graphic Press the Colormap button as shown. Set the color of Class 1 to transparent. Then turn on the image and do some exploring by zooming in and out and panning around to learn more about our project area. 12) Now Save Your Project and minimize ArcView. Transparent Colormap button Class 1 Minnesota GIS/LIS Consortium Spring Workshops 2000’
Elevation data draped on Shaded Relief Notice that this watershed is characterized by a flat upper end with few tributaries and a large valley, more relief, increased drainage in the lower stretches. Minnesota GIS/LIS Consortium Spring Workshops 2000’
Watershed Modeling Workshop • Preprocessing DEMs • DEMs typically require some type of preprocessing prior to hydrologic modeling to remove errors inherent in the data. This type of processing can greatly increase the accuracy of a DEM. • Methods of producing DEMs rarely include a “Drainage Enforcement” Algorithm to remove these errors. • Primary error found in DEMs are “Sinks” • A sink is an erroneous depression created by the DEM interpolation routine Minnesota GIS/LIS Consortium Spring Workshops 2000’
100 100 100 100 100 100 97 96 95 100 100 98 99 100 100 100 100 100 100 101 Watershed Modeling Workshop An example Sink Stream 100-meter Elevation contour Sink Area Cell Elevation 100 Cells containing the contour are assigned the value of the contour, all other cells are interpolated. Sinks are always possible in areas where contours converge near a stream. Minnesota GIS/LIS Consortium Spring Workshops 2000’
Watershed Modeling Workshop • Preprocessing DEM’s (continued) • Drainage Enforcement • Using existing hydrographic features to remove these errors is essential to produce accurate watershed basins. • Sinks are usually small and cause drainage basins to be incorrectly delineated • If a stream is not present elevations in sink areas are raised to elevation of saddle so that water can drain • If a stream is present elevations of saddles are lowered to that of the sink so that water can drain. Minnesota GIS/LIS Consortium Spring Workshops 2000’
Watershed Modeling Workshop • Preprocessing DEM’s (continued) • ArcView can Fill sinks but not enforce other types of hydrologic information • ANUDEM program from Australian National University which is used to enforce known drainage patterns • Arc/Info has a routine called TOPOGRID which is an implementation of this software • Must be careful not to remove real sinks • Lake areas should be flat! • Handles point or contour elevation data Minnesota GIS/LIS Consortium Spring Workshops 2000’
Watershed Modeling Workshop • The flat areas in this shaded elevation model are wetlands and lakes. Minnesota GIS/LIS Consortium Spring Workshops 2000’
Watershed Modeling Workshop • ANUDEM uses stream data to enforce drainage. • Stream data must have correct directionality and connectivity. Minnesota GIS/LIS Consortium Spring Workshops 2000’
Watershed Modeling Workshop • This DEM is considered to be “Hydrologically Adjusted” Minnesota GIS/LIS Consortium Spring Workshops 2000’
Watershed Modeling Workshop ArcView Exercise #2 - PreProcessing DEMs 1) ArcView should still be started and the project, HYDROMOD.APR should still be loaded. If not, then start ArcView and Open the project which can be found in the C:\HYDROMOD folder. 2) Using the mouse, make the theme “Original DEM” active. 3) To remove sinks we will use the DNRHYDRO menu Fill Sinks option (do it now). This option will process the DEM and remove all sinks that are found. In this implementation of the fill routine you do not have any options for specifying size or area of sink to remove. It simply iterates through the data until all sink areas are removed. 4) You will be presented with a prompt “Create Sink Shapefile and Statistics?”. This will find the sinks that were filled and create a shapefile of them with statistics that represent the size and depth of the filled areas. Answer YES to the prompt. Again, ArcView will buzz a little and when done you will be asked to supply a name for this new file - Take the default name SINKPOLY.SHP and make sure it’s in the C:\HYDROMOD folder. 5) When complete, you will have two new themes added to your view document. A Grid theme called “Filled Original DEM” and a polygon theme called “Sinks with Statistics”. Turn off all your other themes and turn on the “Sinks with Statistics” shapefile. See anything? There’s one small polygon in the center of the watershed. To view the statistics, make the “Sinks with Statistics” active and then use the THEME menu, Table option to open the table. You will see that the sink is 700 square meters in size and has a depth of 1 meter. That’s pretty good but remember, this is a hydrologically adjusted DEM. Minnesota GIS/LIS Consortium Spring Workshops 2000’
Watershed Modeling Workshop ArcView Exercise #2 - PreProcessing DEMs 6) Now turn off all your themes and turn on the “Filled Original DEM” theme and make it active. You probably don’t notice much here and it’s not the same color scheme as the original. Let’s create a new legend using the DNR Hydro menu, Interval Legend option. Use an interval of 1, a Base value of 290 and a Max Value of 375 and press the OK button. Then select a color scheme of interest. One of my favorites is “Full Spectrum” but you can choose your own or try a few if you’d like 8) Wow, edit the legend and change the NO Data value color to transparent. Then use the THEME menu Hide/Show Legend option to hide that really long legend and make some room on our table of contents. Then, move the two new themes down a couple of notches on the Table of Contents so that you can display the vector themes (Roads and Watersheds) on top of them. 9) You now have a depressionless DEM, one that can be used for further Hydrologic Analysis. We want to save this file so, make the “Filled Original DEM” theme active and then use the THEME menu Save Data Set option to save this file to C:\HYDROMOD\DEMFILL. 10) Now save your project! Minnesota GIS/LIS Consortium Spring Workshops 2000’
Watershed Modeling Workshop • Generating Surface Parameters • Flow across a surface will always be in the steepest down-slope direction • Known as “Flow Direction” this is the basis of all further watershed modeling processes. • Once the direction of flow is known it is possible to determine which and how many cells flow into any given cell! • This information is used to determine watershed boundaries and stream networks. Minnesota GIS/LIS Consortium Spring Workshops 2000’
Watershed Modeling Workshop • Slope - Many of the parameters that we will discuss and generate in this workshop are based on slope. • Usually calculated on a 3x3 window with the center cell being the target cell. • Slope is calculated from the center cell to each of the 8 neighbors • Greatest slope is assigned to the center cell • Flow direction is that way….. 12 13 13 11 10 10 8 10 9 Target Cell Minnesota GIS/LIS Consortium Spring Workshops 2000’
32 64 128 16 1 Target Cell 8 4 2 Watershed Modeling Workshop • Generating Surface Parameters - Flow Direction • In ArcView Spatial Analyst, the output of a Flow Direction is a grid whose values can range from 1 to 255 based on the direction water would flow from a particular cell. The cells are assigned valued as shown below. Minnesota GIS/LIS Consortium Spring Workshops 2000’
Watershed Modeling Workshop • Generating Surface Parameters - Flow Direction • If a cell is lower than its eight neighbors, that cell is given the value of its lowest neighbor and flow is defined towards this cell. • If a cell has the same slope in all directions the flow direction is undefined (lakes) • If a cell has the same slope in multiple directions and is not part of a sink the flow direction is calculated by summing the multiple directions Minnesota GIS/LIS Consortium Spring Workshops 2000’
100 2 100 2 100 2 1 100 128 94 1 100 1 97 96 1 95 128 100 64 100 128 98 128 99 128 64 100 100 32 100 128 100 64 64 100 32 100 101 80 Watershed Modeling Workshop • Flow Direction Original Surface Flow Direction Surface Minnesota GIS/LIS Consortium Spring Workshops 2000’
Watershed Modeling Workshop • Flow Direction Minnesota GIS/LIS Consortium Spring Workshops 2000’
Watershed Modeling Workshop • Generating Surface Parameters - Flow Accumulation • If we know where the flow is going then we can figure out what areas (cells) have more water flowing through them than others. • By tracing backwards up the flow direction grid we can figure the number of cells flowing into all cells in a study area • Accumulated flow is calculated as the accumulated number of all cells flowing into each downslope cell. Minnesota GIS/LIS Consortium Spring Workshops 2000’
Watershed Modeling Workshop • Generating Surface Parameters - Flow Accumulation • For an accumulation surface the value of each cell represents the total number of cells that flow into an individual cell • Cells that have high accumulation are areas of concentrated flow and may be used to identify stream channels. Minnesota GIS/LIS Consortium Spring Workshops 2000’
0 0 0 0 18 0 3 8 15 0 0 2 2 0 0 0 0 0 0 0 Watershed Modeling Workshop Flow Direction Surface Flow Accumulation Surface 2 2 2 1 128 1 1 1 128 64 128 128 128 64 32 128 64 100 32 80 Minnesota GIS/LIS Consortium Spring Workshops 2000’
Watershed Modeling Workshop Flow Accumulation Surface Minnesota GIS/LIS Consortium Spring Workshops 2000’
Watershed Modeling Workshop • Generating Surface Parameters - Flow Length • Another parameter that can be calculated is flow length • Flow length is defined as the length of the longest flow path within a drainage basin or watershed. This measure is often used to calculate the time of concentration of a basin. • ArcView calculates the flow length for each cell within the basin. The cell values represent the length of flow to an outlet from that point. Minnesota GIS/LIS Consortium Spring Workshops 2000’
144.6 2 2 114.6 2 84.6 1 30 0 128 132.3 1 1 102.3 72.3 1 128 42.3 64 30 144.6 128 128 114.6 84.6 128 64 72.3 32 84.6 128 156.9 126.9 64 100 114.6 126.9 32 0 80 Watershed Modeling Workshop Flow Direction Surface Flow Length Surface Assuming 30 meter sq. cells Minnesota GIS/LIS Consortium Spring Workshops 2000’
Watershed Modeling Workshop Flow Length Surface Minnesota GIS/LIS Consortium Spring Workshops 2000’
Watershed Modeling Workshop • The Whole Process - a Flowchart Minnesota GIS/LIS Consortium Spring Workshops 2000’
Watershed Modeling Workshop ArcView Exercise #3 - Generating Land Surface Parameters 1) ArcView should still be started and the project, HYDROMOD.APR should still be loaded. If not, then start ArcView and Open the project which can be found in the C:\HYDROMOD folder. Make sure that the “Digital Elevation Model” View is open and active. 2)The first step in this process is to create the Flow Direction theme. We use an elevation theme as our base so make the “Filled Original DEM” theme active and then use the DNR HYDRO menu Flow Direction option to create this grid. The computer will whir for awhile and then add a new theme called “Flow Direction”. Turn this theme on. Notice the cell values in the legend. Remember that 1 represents east flow direction etc. You may also notice that this is really showing us the aspect of the landscape. Edit the legend for this theme and then press the Load button to load the legend file: C:\HYDROMOD\FLOWDIR.AVL. Use the defaults and apply the legend. 4) Now we’re ready to create the Flow accumulation grid. To do this, make the “Flow Direction” grid active and then use the DNR HYDRO menu Flow Accumulation option to create this theme. You will then be requested to enter a “Flow Accumulation Weight Grid”. We don’t have one at this time so press the CANCEL button. At this point the computer will process for a bit and then add a new theme to your View called “Flow Accumulation” (surprise). 5) Turn on this grid and have a look. All you really see in this display is one area that look like they could be stream channel. What you’re looking at here is an artifact of the legend. To create a better looking view of this surface we can modify the legend to show more of the concentrated flow network. To do this create a legend that has the following classes: 0 - 100 100 - 10000 10000 - 25000 25000 - 50000 50000 - 260000 Minnesota GIS/LIS Consortium Spring Workshops 2000’
Watershed Modeling Workshop ArcView Exercise #3 - Generating Land Surface Parameters Then colorize the classes and apply the legend. You should see a much better display of the drainage channels in the landscape. Let’s assume that any cell with less than a 100 cell accumulation is most likely overland flow so make this class transparent in your legend. Also make the NO DATA class symbol transparent. 6) Now let’s calculate flow length for every cell in the watershed. To do this make sure that the “Flow Direction” theme is active and then press the DRN HYDRO menu Flow Length option. 7) You will be asked if you want to calculate the flow length to an outlet. In other words, do you want ArcView to find an outlet and calculate flow length from there. The answer in this case is yes. ArcView will then create the flow length grid called “Downstream Flow Length” and add it to your view document. 8) Examine the grid. What does this tell you? Save your project…… 9) Let’s look at how stream ordering can be created from this “Flow Accumulation” theme. To save some time I’ve already created these data sets. You will find two Grid Data sets in the C:\HYDROMOD subdirectory, one called STRAHLER and one called SHREVE. Add these two themes to your View Document. Notice the difference between the two systems, most notably the difference in maximum stream order. You could convert these to Vector representations of flow channels if desired. Minnesota GIS/LIS Consortium Spring Workshops 2000’