Valuation – Bonds and Stocks
660 likes | 971 Vues
Valuation – Bonds and Stocks. BONDS We hear a lot about the stock market in the popular press, but not much about the bond market It may surprise you to learn that the U.S. bond market is over twice the size of the U.S. stock market Total outstanding debt in 2007: $29.2 trillion

Valuation – Bonds and Stocks
E N D
Presentation Transcript
BONDS • We hear a lot about the stock market in the popular press, but not much about the bond market • It may surprise you to learn that the U.S. bond market is over twice the size of the U.S. stock market • Total outstanding debt in 2007: $29.2 trillion • Total market value of common stock: $14.2 trillion • In general, bonds are less risky than stocks • But, like all assets, high-yield bonds have higher risk
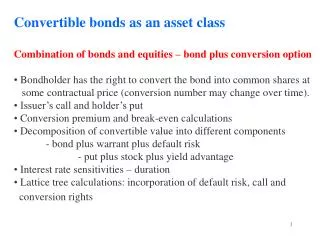
Corporate Bonds Bond ratings go from AAA(Best credit) to CCC. If the rating is D, then it is considered in default. BBB or better is considered investment grade, 0.5% or less chance of default. BB and below, historically default rate is around 4% but has reached above 10% in 90-91, 2001 for example.
Which to buy? • High Yield vs Investment grades • Example • AAA 5% with .2% historical default • B, 9% with 4% historical default rate • 40% recovery rate on defaults • Return = (1 – default rate) * interest rate – default rate * (1-recovery rate) • Return for A, .998 * .05 - .002*.6 = 4.87%. • Return for B, .96 * .09 - .04 * .6 = 6.24%
Bond Valuation • The value of a bond represents the present value of future cash flows. • Bonds are easier to value than stocks because in the case of bonds, the cash flows are known • Coupon amount • Par value • Investors also know the time remaining to maturity, and the prevailing market interest rate for bonds of similar risk
Examples Calculate Price, Annual coupon, semi-annual coupon. What happens when interest rates change? How does maturity affect risk? How does coupon affect risk? Discount, Premium, at Par
Holding period return • Assume you buy a 10 year 8% annual coupon bond yielding 8%. 2 years later it is yielding 6%. What is your return?
Other Issues: Yield to Call • The YTM calculation assumes that the bond is held to maturity • What if the bond is called by the issuer prior to maturity? The investor would receive only the coupon payments up to the point of call, plus the call price • This is called the Yield to Call
Callable bonds are an advantage for the issuer, but a disadvantage for the investor • If interest rates fall, the issuer can recall the more expensive debt and issue new debt at the new lower interest rate • The investor is left with cash, just when interest rates are lower • The call provision effectively puts a ceiling on the price of a bond • If interest rates fall enough, the bond will be called • Investors are not stupid – they require higher yields from callable bonds versus otherwise equivalent non-callable bonds
-1106.38 35 1070 INPUT 40 N I/YR PV PMT FV OUTPUT 2.875 • Example: • 20-year bond with 7 percent coupons, semiannual • The bond can be called in 5 years at a call price of 1,070 • The bond’s market price is $1,106.38. • Calculate the Yield to Call: • YTC = 2 x 2.875 = 5.75%
Municipal Bonds and Yield • Municipal bonds appear to offer low yields compared with corporate bonds and Treasury securities. • This is because the interest from municipal bonds is tax exempt at the federal level, and generally at the state level as well • In order to compare yields, we must compute the after-tax yield on municipal bonds
Taxable equivalent yield • Example: Pre-tax yield on municipal bond is 5%, and investor’s marginal tax rate is 35% • Equivalent taxable yield = 5 / (1-.35) = 7.69% • Municipal bonds are more attractive to high-income investors (with high marginal tax rates)
Duration • A measure of the effective maturity of a bond • The weighted average of the times until each payment is received, with the weights proportional to the present value of the payment • Duration is shorter than maturity for all bonds except zero coupon bonds • Duration is equal to maturity for zero coupon bonds
Uses of Duration • Summary measure of length or effective maturity for a portfolio • Immunization of interest rate risk (passive management) • Net worth immunization • Target date immunization • Measure of price sensitivity for changes in interest rate
Duration/Price Relationship Price change is proportional to duration and not to maturity DP/P = -D x [D(1+y) / (1+y) D* = modified duration D* = D / (1+y) DP/P = - D* x Dy
Pricing Error from Convexity Price Pricing Error from Convexity Duration Yield
Correction for Convexity Modify the pricing equation: Convexity is Equal to: Where: CFt is the cashflow (interest and/or principal) at time t.
Stock Investing: October, this is one of the peculiarly dangerous months to speculate in stocks. The others are July, January September, April, November, May, March, June, December, August and February. Mark Twain, 1899.
Common Stock • Equity securities (stocks) represent ownership in a corporation • Common stockholders are residual claimants • The have a claim on cash flows only after all other claimants (employees, suppliers, debtholders, the government) have been paid • At any point in time the market value of a firm’s common stock depends on many factors including: • The company’s profitability (cash flows) • The company’s growth potential • Current market interest rates • Conditions in the overall stock market
Valuation Approach • Examine Economic Environment(Federal Reserve Forecasts is a good place to start) • Examine Industry/Sector Environment • Examine Company • Examine Price • Best of all worlds: Finding a good company in a growing industry within an expanding economy that is undervalued. A tall order. • We will not focus on the economic and industry environment in this class, but will start with some simple financial statement analysis to determine if we are dealing with a good company, and then look at valuation models to see if it is selling at an attractive price.
Introduction • The real value of financial statements lies in the fact that managers, investors, and analysts can use the information in the statements to: • Analyze firm performance • Plan changes to improve performance • Ratio Analysis • Calculating and analyzing financial ratios to assess a firm’s performance
Ratios fall into five groups: • Liquidity ratios • Asset management ratios • Debt management ratios • Profitability ratios • Market value ratios • After managers, analysts, or investors calculate a firm’s ratios they make two comparisons: • Trend – comparison to the same firm over time • Competitors – comparison to other firms in the same industry
Liquidity Ratios Liquidity ratios provide an indication of the ability of the firm to meet its obligations as they come due The two most common liquidity ratios are the current ratio and the quick (or acid-test) ratio.
The broadest liquidity measure is the current ratio, which measures the dollars of current assets available to pay each dollar of current liabilities Current Ratio = CA / CL • Inventory is the least liquid of the current assets, and is the current asset for which book values are the least reliable measure of market value. The quick, or acid-test ratio excludes inventory in the numerator, and measures the firm’s ability to pay off short-term obligations without relying on inventory sales: Quick Ratio = (CA – Inventory) / CL
Asset Management Ratios Asset management ratios measure how efficiently a firm uses its assets Many of these ratios are focused on a specific asset, such as inventory or accounts receivable. We will examine inventory and total asset turnover.
Inventory Management • The inventory turnover ratio measures the dollars of sales produced per dollar of inventory. Often this ratio uses cost of goods sold in the numerator rather than sales since inventory is listed on the balance sheet at cost Inventory Turnover = Sales / Inventory or Inventory Turnover = Cost of Goods Sold / Inventory • Total Asset Management • The Total Asset Turnover ratio measures the dollars of sales produced per dollar of total assets Total assets turnover ratio = Sales / Total assets
Debt Management Ratios • Debt management ratios measure the extent to which the firm uses debt (financial leverage) versus equity to finance its assets. We will examine the following four: • The debt ratio measures the percentage of total assets financed with debt. Debt ratio = Total debt / Total assets • The debt-to-equity ratio measures the dollars of debt financing used for every dollar of equity financing. Debt-to-equity ratio = Total debt / Total equity
The Equity Multiplier ratio measures the dollars of assets on the balance sheet for every dollar of equity financing Equity multiplier ratio = Total assets / Total equity • The Times Interest Earned ratio measures the number of dollars of operating earnings available to meet each dollar of interest obligations Times interest earned = EBIT / Interest expense
Profitability Ratios • These ratios show the combined effect of liquidity, asset management, and debt management on the overall operating results of the firm • These ratios are closely monitored by investors • Stock prices react very quickly to unexpected changes in these ratios. We will look at the profit margin, ROA, and ROE. • The Profit Margin is the percent of sales left after all firm expenses are paid Profit margin = Net income available to common stockholders / Sales
The Return on Assets (ROA) measures the overall return on the firm’s assets, inclusive of leverage and taxes Return on Assets (ROA) = Net income available to common stockholders / Total Assets • The Return on Equity (ROE) measures the return on common stockholders’ investment Return on Equity (ROE) = Net income available to common stockholders / Common stockholders’ equity • ROE is affected by net income as well as the amount of financial leverage • A high ROE is generally considered to be a positive sign of firm performance • Unless it is driven by excessively high leverage
Market Value Ratios While ROE is a very important financial statement ratio, it doesn’t specifically incorporate risk. Market prices of publicly traded firms do incorporate risk, and so ratios that incorporate stock market values are important. We will look at two, Market to book and PE
The Market-to-Book ratio measures the amount that investors will pay for the firm’s stock per dollar of equity used to finance the firm’s assets Market-to-book ratio = Market price per share / Book value per share • Book value per share is an accounting-based number reflecting historical costs • This ratio compares the market (current) value of the firm's equity to their historical costs. • If liquidity, asset management, and accounting profitability are good for a firm, then the market-to-book ratio will be high
The Price-Earnings ratio is the best known and most often quoted figure Price-earnings ratio = Market price per share / Earnings per share • Measures how much investors are willing to pay for each dollar of earnings • A high PE ratio is often an indication of anticipated growth • Stocks are classified as growth stocks or value stocks based on the PE ratio
DuPont Analysis • DuPont analysis is a decomposition model • ROA and ROE can be broken down into components in an effort to explain why they may be low (or high). • ROE = profit margin x total asset turnover x equity multiplier • ROE = NI/Sales x Sales/Total Assets x Total Assets/Total Equity • The DuPont model focuses on • Expense control (Profit Margin) • Asset utilization (TA turnover) • Debt utilization (Equity Mult)
Time Series and Cross-Sectional Analysis • To analyze ratios in a meaningful way they must be compared to some benchmark • There are two types of benchmarks: • Performance of the firm over time (time series analysis) • Performance of the firm against other companies in the same industry (cross-sectional analysis) • Comparative ratios for industries are available from Value Line, Robert Morris Associates, Dun & Bradstreet, Hoover’s Online, and MSN Money
Fundamental Stock Analysis: Models of Equity Valuation: IS IT UNDERVALUED? • Basic Types of Models • Balance Sheet Models • Dividend Discount Models • Price/Earning Ratios • Estimating Growth Rates and Opportunities
Dividend Discount Models:General Model • V0 = Value of Stock • Dt = Dividend • k = required return
No Growth Model • Stocks that have earnings and dividends that are expected to remain constant • Preferred Stock
No Growth Model: Example E1 = D1 = $5.00 k = .15 V0 = $5.00 / .15 = $33.33
Constant Growth Model • g = constant perpetual growth rate
Constant Growth Model: Example E1 = $5.00 b = 40% k = 15% (1-b) = 60% D1 = $3.00 g = 8% V0 = 3.00 / (.15 - .08) = $42.86
Additional Valuation Methods • Variable Growth Techniques • For high-growth firms, we can’t use the constant growth formula because we know that the firm can’t sustain the high growth forever • These firms may have two different growth rates • Growth during the supernormal growth period • Steady growth after the firm matures • We can use a multistage growth formula for these firms, but we can also use discounted cash flows in combination with the constant growth model
Example: Suppose a firm currently has a dividend of D0 = $5. We expect the firm to grow at a rate of 10% for three years, after which it will grow at 4% forever. The required return is 9%. • First we can calculate the dividends: • D1 = 5(1+.10) = 5.50 • D2 = 5.50(1.10) = 6.05 • D3 = 6.05(1.10) = 6.655 • D4 = 6.655(1.04) = 6.92
Now we can calculate the present value of all of the dividends in periods 4 to ∞, where the growth is constant forever P3 = D4/(kg) = 6.92/(.09-.04) = 138.42 Now we have all the cash flows, and we can find P0 P0 = 5.50/1.091 + 6.05/1.092 + (6.655 + 138.42)/1.093 = $122.17
Estimating some key inputs for Multi-Stage Growth Models • Cash flow estimate • Dividends • Operating Cash Flow • Free Cash Flow to Equity (what could be paid out and remain a going concern): NI - (1 – debt ratio) *( Change in Working Capital + Cap. Expend. – Depreciation) • Cost of Capital/Required Return • Bond Yield + premium, premium 5% or so • Capm: Return = risk free + B(Expected Market Return – risk free) • Your own personal required return • Growth • A) Geometric or Average growth rates of Earnings, Sales, Cash Flows • B) Intrinsic Growth, ROE (1 – payout ratio) • C) Analyst Estimates
Estimating Dividend Growth Rates • g = growth rate in dividends • ROE = Return on Equity for the firm • b = plowback or retention percentage rate • (1- dividend payout percentage rate)