Download
1 / 19
190 likes | 280 Vues
Global Warming and Hurricane Activity and the Impact on U.S. Transportation. Dr. Douglas A. Stewart and Dr. Lee E. Branscome Climatological Consulting Corporation Palm Beach Gardens, Florida. Factors Influencing Hurricane…. Size. Intensity. Rainfall. Formation frequency.

E N D
Global Warming and Hurricane Activity and the Impact on U.S. Transportation Dr. Douglas A. Stewart and Dr. Lee E. Branscome Climatological Consulting Corporation Palm Beach Gardens, Florida
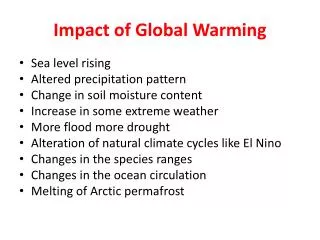
Factors Influencing Hurricane… • Size • Intensity • Rainfall • Formation frequency • Geographical distribution Is Global Warming Linked to Hurricane Activity? • Modeling studies • Metrics of activity • The linkage debate • Empirical studies • Natural variability Impact on Transportation Infrastructure
Hurricane intensity • Underlying SST • Upper level disturbances • Depth of warm water • Eye wall replacement cycles • Wind shear • Lateral moisture flux Maximum Potential Intensity (MPI) Theory Emanuel’s MPI (Emanuel 1986,1987,1991) Holland’s MPI (Holland 1997)
Hurricane formation frequency • Favorable environment (SST, low wind shear, deep moist layer) • Incipient disturbance of independent origin • Distance from equator (Coriolis effect to induce rotation) Emanuel’s genesis index (http://wind.mit.edu/~emanuel/gindex.htm ) h=Absolute vorticity H=600mb R.H. Vp=potential wind speed (MPI) Vs=wind shear |v850-v250| G.I.=|105h|3/2(H/50)3(Vp/70)3(1+0.1Vs)-2
Geographical distribution of hurricanes • Characteristics/locations of incipient disturbance • (e.g., frontal perturbation, easterly wave) • Quasi-stationary large-scale circulation features • Spatial distribution of SST anomalies 1995: 19 named storms 2004: 15 named storms (http://www.tpc.ncep.noaa.gov/tracks)
NAO Effect • NAO Patterns for • July and October • (+ phase) • Tropical cyclones during NAO extremes • (monthly NAO data from 1950-2005) 10% of storms @ max (-) NAO index 10% of storms @ max (+) NAO index • Monthly NAO index averaged over individual hurricane seasons 1960 1970 1950 1980 1990 2000
ENSO Effect Tropical cyclones during ENSO extremes Multivariate ENSO Index data from 1950-2005 (NOAA-CIRES CDC) HURDAT best track data from 1950-2005 10% of storms @ max (-) ENSO index 10% of storms @ max (+) ENSO index 25% of storms @ max (-) ENSO index 25% of storms @ max (+) ENSO index • Monthly ENSO index averaged over individual hurricane seasons 1960 1970 1950 1980 1990 2000
Hurricane size • Radius of maximum winds (RMW); cloud shield • Historical database on RMW is limited in quantity and quality Charley 2004: Cat 4 Wilma 2005: Cat 3 (http://www.tpc.ncep.noaa.gov)
Impacts from large and small storms NCDC image, courtesy Dr. Jack Beven (http://www.mindspring.com/~jbeven/intr0012.htm) • Some damages from small storms (adjusted to 2005 dollars) Andrew: cat 5 (35.9B); Charley: cat 4 (15.4B); Camille: cat 5 (7.5B) • Some damages from large storms (adjusted to 2005 dollars) Frances: cat 2 (9.1B); Jeanne: cat 3 (7.1B); Floyd: cat 2 (5.1B) Katrina: cat 3 (e75B); Rita: cat 3 (e10B); Wilma: cat 2 (e12.2B) • Factors governing hurricane size largely unknown • More observations, theory and hi-res modeling needed
Hurricane rainfall • Large hurricanes produce more rainfall than small • Slow moving storms produce more rainfall locally • 10-15 inches not uncommon • (Mitch (1998) produced 25 inches in 36 hours in southern Honduras) • Tropical storms may be copious rain producers • (Claudette, 1979 produced 45 inches near Alvin, TX; • Allison, 2001 produced > 30 inches on parts of Houston.TX) • Local topography may result in flash flooding • (often contributing to the majority of fatalities) • City drainage easily overwhelmed in flat coastal regions Changes in a warming climate? • Limited historical data on hurricane rainfall amounts • Estimates from radar and satellite are for limited samples only • Increased hurricane rainfall likely From modeling studies…as high as 40% increase for intense storms (Gutowski, 1994) and 18% increase for storms within 100 km of center (Knutson and Tuleya, 2004) are estimated in a doubled CO2 climate]
Is global warming influencing hurricane activity ? Coupled Global Models (CGM) • Hurricane activity in control vs. warm climate simulations • Conflicting results in hurricane frequency • Problems with simulating hurricanes and their genesis • Some robust results Hybrid Models • Hi-res hurricane simulations with CGM BCs • Ignores genesis frequency issues • Tests MPI theory • Rainfall sensitivity Empirical Studies • Cyclone activity metrics over period of record • Secular trend vs. natural variability • Limited records- statistical significance issues • Non-uniformity of measurement methods • Tests MPI theory • Stimulates further theoretical inquiry
Hybrid Model Study Knutson and Tuleya (2004)- J. Climate Do models show increased hurricane intensity and rainfall in a warmer climate? • Temperature and moisture profiles and SST from 9 CGMs used as background • Simulate control climate and warm climate (1% CO2 increase/yr) • ~1300 5-day idealized hurricane simulations with the GFDL hurricane model (3 ocean basins (ATL,WPAC,EPAC); 4 convective parameterizations) Hurricane intensity distribution: Aggregate results Cat 4 Cat 3 Cat 5 Minimum central pressure (mb) • 14% increase in central pressure fall • 6% increase in max surface winds • 18% increase in precipitation within 100 km of center • 2x increase in cat-5 storm probability
Empirical Study Trenberth (2005)- Science Look for trends in Atlantic SST and hurricane activity [Accumulated Cyclone Energy Index] (ACE= sum of Vm2 over cyclone lifetime for all storms in a season) SST over Atlantic basin from 1870-2004 Annual ACE variability from 1950-2004.
Empirical Study Emanuel (2005)- Nature Trends in Atlantic and Pacific SST and hurricane activity [Power Dissipation Index] (PDI= sum of Vm3 over cyclone lifetime for all storms in a season) ATL ATL+WPAC WPAC
Empirical Study Webster et al. (2005)- Science Trends in cyclone number, duration and intensity in a warming environment (satellite era only; 1970-2004) • 6 ocean basins: NATL, WPAC, EPAC, SPAC, NIO, SIO • No distinct secular trend in storm numbers or duration, globally • Only secular trend in number and duration is in the NATL basin • No trend in maximum wind speed of hurricanes • Distinct secular trend in number of intense hurricanes, globally
ATL Hurricane Activity Metrics (HURDAT 1870-2005) Storm numbers U.S. Landfalls Storm duration ACE # Storms All (TS + H) % of median % of median % of median PDI Major H # cat-3,4,5 % of median Number % of median 1870 1950 2005 Storm Days Cat-4,5/hur % of median ATL SST variability % ATL SSTA 1950 1870 1870 2005 1950 2005
Global Warming->Increased Hurricane Activity? • Peer-reviewed studies establish a link between increased hurricane • intensity and increased SST (Trenberth, 2005; Emanuel, 2005; Webster et al., 2005) • Warming SST attributed to increased greenhouse gas emissions (IPCC,2001) • Skeptics claim: • No trends, only multi-decadal fluctuations • SST signal part of the natural variability • Past data are erroneous • Land-falling storms do not support linkage • Metrics of hurricane activity are misleading • The skeptics choose the press rather than the scientific peer-review process • There are still many unknowns • Why 80-90 global hurricanes/yr and not 25 or 200? • Why do storm numbers decrease while intensities increase in most basins? • What is the role of hurricanes in the global heat redistribution?
Impact on Transportation Infrastructure Increased risk of: • Surge and wave damage to ports, bridges, coastal airports and highways • Inland wind/rain damage: • Orlando Int. Airport’s damage from Charley, Frances, Jeanne (2004); Homestead Airport destruction from Andrew (1992) • Traffic signals/sign destruction • Adverse impacts on fuel costs and availability: • Damage to offshore drilling platforms and coastal refineries • Energy price shocks from more frequent threats Significant impact on infrastructure: • Location of new infrastructure will require higher elevations • Greater Likelihood of wind/flood/surge damage over the lifetime of the structure.