Chap. 2. Water (Part B)
250 likes | 275 Vues
Chap. 2. Water (Part B). Topics Weak interactions in aqueous systems Ionization of water, weak acids, and weak bases Buffering against pH changes in biological systems Water as a reactant Fitness of the aqueous environment for living organisms. Fig. 2-2. Hydrogen bonding in ice.

Chap. 2. Water (Part B)
E N D
Presentation Transcript
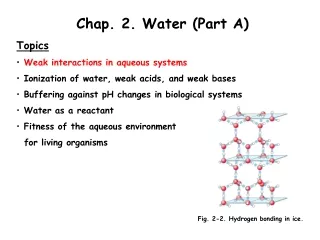
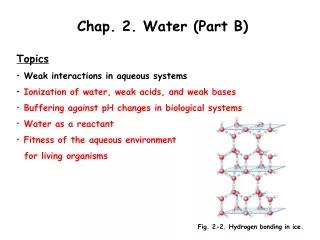
Chap. 2. Water (Part B) • Topics • Weak interactions in aqueous systems • Ionization of water, weak acids, and weak bases • Buffering against pH changes in biological systems • Water as a reactant • Fitness of the aqueous environment • for living organisms Fig. 2-2. Hydrogen bonding in ice.
Ionization of Water Water molecules have a very slight tendency to ionize to a hydrogen ion and a hydroxide ion H2O H+ + OH-. Actually, free protons (H+) do not exist in solution, and instead, hydrogen ions formed in water are immediately hydrated to form hydronium ions (H3O+). Through proton hopping (Fig. 2-14), the short hops of protons between a series of hydrogen-bonded water molecules results in a very rapid net movement of a proton over a long distance. Thus the movement of hydronium (and hydroxide) ions in an electric field is extremely fast compared to the movement of ions such as Na+ and Cl-.
Equilibrium Constant for H2O Ionization (I) The equilibrium constant for the reversible ionization of water is Keq = [H+] [OH-] / [H2O]. In pure water at 25˚C, the concentration of H2O is 55.5 M. On rearranging, the equation becomes (55.5 M) (Keq) = [H+] [OH-] = KW where KW designates the product (55.5 M) (Keq) and is the ion product of water. Since the value of Keq, determined by electrical conductivity measurements is 1.8 x 10⁻¹⁶ M, the equation becomes KW = [H+] [OH-] = (55.5 M) ( 1.8 x 10⁻¹⁶ M) or KW = [H+] [OH-] = 1.0 x 10⁻¹⁴ M2.
Equilibrium Constant for H2O Ionization (II) The above calculations indicate that the product [H+] [OH-] in aqueous solution at 25˚C always equals 1 x 10-14 M2. Thus, when the concentrations of H+ and OH- in solution are equal (a neutral solution at neutral pH, see below) [H+] = [OH-] = √KW = √1 x 10-14 M2 = 1 x 10⁻⁷ M. Worked Examples 2-3 and 2-4 from the text will be covered in class to show how the concentrations of H+ and OH- in solution are determined using the ion product of water equation KW = [H+] [OH-] = 1.0 x 10⁻¹⁴ M2.
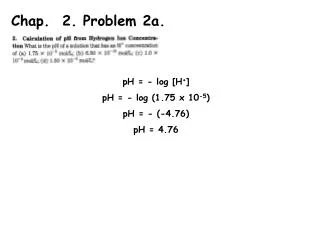
The pH Scale The ion product of water, KW, is the basis for the pH scale (Table 2-6). The pH scale is a convenient way of designating the concentrations of H+ and OH- in solution in the range between 1.0 M H+ and 1.0 M OH-. The pH is defined by the equation pH = -log [H+]. A precisely neutral solution occurs when [H+] = [OH-], and thus when pH = 7.0. Solutions in which [H+] > [OH-] are acidic and have pH values less than 7.0. Solutions in which [H+] < [OH-] are basic and have pH values greater than 7.0.
pH Values of Some Common Liquids The pH values of some common aqueous fluids are shown in Fig. 2-15. Remember that the pH scale is logarithmic, and solutions that differ by one pH unit actually differ by 10-fold in [H+]. The [H+] of a solution of known pH is calculated by rearranging the pH equation to its exponential form: [H+] = 10-pH. The pH of biological solutions is carefully controlled because pH strongly affects the structure and activity of biological macromolecules, e.g., enzymes.
Dissociation Constants of Weak Acids and Bases (I) Unlike strong acids (HCl, H2SO4) and strong bases (NaOH, KOH), weak acids and bases (e.g., acetic acid (CH3COOH) and amino acids) are not completely ionized when dissolved in water. Instead, depending upon the pH, both the proton donor species (conjugate acid) and proton acceptor species (the conjugate base) occur together in solution. Each weak acid has a characteristic tendency to lose its proton in aqueous solution. The stronger the acid, the greater the tendency to ionize. The tendency of any conjugate acid (HA) to lose a proton and form its conjugate base (A-) is defined by the equilibrium constant (Keq) for the reversible reaction HA H+ + A- For which Keq = [H+][A-]/[HA] = Ka. Equilibrium constants for ionization reactions are usually called acid dissociation constants, Ka. (Continued on the next slide)
Dissociation Constants of Weak Acids and Bases (II) The higher the value of Ka, the stronger the acid. Biochemists also commonly convert Ka values to their logarithmic forms, pKa. pKa = -log Ka. The lower the value of the pKa, the stronger the acid. pKas commonly are determined by titration of weak acids. Also note that the Ka of a weak acid can be calculated from the pKa by using the exponential form of the pKa equation, namely Ka = 10-pKa.
Conjugate Acid-base Pairs of Weak Acids and Bases The dissociation reactions for a number of common mono-, di-, and triprotic weak acids and bases are shown in Fig. 2-16. The pKa values for the dissociation reactions are shown where they occur along a pH gradient.
Titration Curves and the pKa (I) Titrations are used to determine the amount of weak acid in a solution. Titrations also yield the pKa value for a weak acid. In a titration, the conjugate acid form (HA) of a weak acid is stoichiometrically converted to its conjugate base form (A-) by the addition of a strong base. The titration curve for acetic acid is shown in Fig. 2-17. As discussed below, the pKa value of the acid is equivalent to the pH obtained at the midpoint of the titration curve where 50% of the acid has been neutralized.
Titration Curves and the pKa (II) Two reversible equilibria are involved in the titration of a weak acid such as acetic acid (HAc). H2O H+ + OH- HAc H+ + Ac-. These equilibria simultaneously obey their characteristic equilibrium equations KW = [H+] [OH-] = 1.0 x 10⁻¹⁴ M2 Ka = [H+] [Ac-] / [HAc] = 1.74 x 10⁻⁵ M. As OH- is added, it combines with H+ to form water. As free H+ is removed, HAc subsequently dissociates to satisfy its own equilibrium equation. The net result is that during the titration, more and more HAc is converted to Ac-. When an amount of base stoichiometrically equivalent to the amount of HAc originally in solution has been added, the titration is complete.
Titration Curves and the pKa (III) The titration curves of all weak acids have the same shape (Fig. 2-18). They only differ with respect to where the midpoints of the curves (pKas) intersect the pH axis of the graphs. The region in which buffering ability is the highest for each weak acid corresponds to a pH range where approximately 10% to 90% of the proton donor species has been neutralized. This is the same as the pH range ±1 pH unit above and below the pKa.
Buffer Systems Buffers are aqueous solutions that tend to resist changes in pH when small amounts of strong acid (H+) or base (OH-) are added. An optimum buffer consists of equal amounts of the conjugate acid and conjugate base forms of a weak acid in solution. As shown from titration curves, pH changes are the smallest at the midpoint of the titration curve (plateau region) where [HA] = [A-] on addition of acid or base. At this point the pH is equivalent to the pKa of the weak acid. Because buffer systems have both HA and A- species, they are capable of absorbing either strong base or strong acid as illustrated for acetic acid in Fig. 2-19. Whenever acid or base is added to the buffer there is a small change in the ratio of the conjugate base and conjugate acid, and thus a small change in the pH. The sum of the buffer components in solution does not change, only their ratio changes.
The Henderson-Hasselbalch Equation (I) The shape of the titration curves for all weak acids is described by the Henderson-Hasselbalch equation. This equation simply restates the expression for the ionization of a weak acid, HA, as shown in the following derivation: Ka = [H+] [A-] / [HA] After solving for [H+], the equation becomes [H+] = Ka [HA] /[A-]. Then take the negative logarithm of both sides -log [H+] = -log Ka - log [HA] / [A-] After substituting pH and pKa into the equation, it becomes pH = pKa - log [HA] / [A-] Finally, the Henderson-Hasselbach equation results after mathematical manipulation of the log term on the right, namely pH = pKa + log [A-] / [HA]
The Henderson-Hasselbalch Equation (II) Examination of this equation shows that [A-]/[HA] = 10/1 when pH = pKa + 1 [A-]/[HA] = 1/1 when pH = pKa (midpoint of a titration curve) [A-]/[HA] = 1/10 when pH = pKa - 1 Remember A- is the conjugate base of HA, and HA is its conjugate acid. The Henderson-Hasselbalch equation allows us to calculate (1) pKa, given pH and the molar ratio of proton acceptor and donor in solution; (2) pH, given pKa and the molar ratio of proton acceptor and donor; and (3) the molar ratio of proton acceptor and donor, given pH and pKa.
The Histidine R Group Buffer System Cells and extracellular fluids contain a high concentration of proteins. Histidine is an amino acid that occurs in most proteins. The R group (side-chain) of histidine (see Chap. 3) has an imidazole functional group that undergoes reversible protonation (Fig. 2-20). Because the pKa of the imidazole R group is 6.0, histidine residues in proteins help buffer the pH of the cell cytosol and extracellular fluids around neutrality. The cell cytosol also is buffered by phosphate, which has a pKa of 6.86 (see below). The blood also is buffered by the bicarbonate system.
Bicarbonate Buffer System (I) The bicarbonate buffer system is an effective physiological buffer near pH 7.4. As shown below, this is because H2CO3 of blood plasma is in equilibrium with the large reserve capacity of CO2(g) in the air space of the lungs. This buffer system involves three reversible equilibria (below), in this case between gaseous CO2 in the lungs and bicarbonate (HCO3-) in the blood plasma (Fig. 2-21). H2CO3 H+ + HCO3- K1 = [H+][HCO3-]/[H2CO3] CO2(d) + H2O H2CO3 K2 = [H2CO3]/[CO2(d)][H2O] CO2(g) CO2(d) K3 = [CO2(d)]/[CO2(g)]
Bicarbonate Buffer System (II) When H+ is added to blood plasma as it passes through peripheral tissues, Reaction 1 in Fig. 2-21 shifts towards the production of H2CO3. This in turn increases CO2(d) in the blood (Reaction 2) and thus increases the partial pressure of CO2(g) in the air space of the lungs (Reaction 3). The extra CO2 is then exhaled. When H+ is lost from the blood plasma, the opposite events occurs. More H2CO3 dissociates into HCO3- and H+ and thus more CO2(g) from the lungs dissolves in the blood. The rate of inhaling and exhaling, which is controlled by the brain stem in response to pH changes in the blood plasma, can quickly adjust these equilibria to keep the pH of blood nearly constant. The partial pressure of CO2 in the gas phase is denoted as pCO2.
Bicarbonate Buffer System (III) At the pH of the blood plasma (7.4) very little H2CO3 is present in comparison with HCO3- (Note that the pKa for H2CO3 is 3.57 at 37˚C). So why is the HCO3-/H2CO3 buffer system effective at buffering the blood near pH 7.4? The answer is that there is a very large reservoir of CO2(d) in the blood which is in rapid equilibrium with H2CO3 via Reaction 2 in Fig. 2-21. In clinical medicine it is common to refer to CO2(d) as the conjugate acid of the bicarbonate buffer system. Further a simple expression analogous to the HH equation can be derived (see text) to calculate blood pH from the amounts of CO2(d) and HCO3- in blood: pH = 6.1 + log [HCO3-]/(0.23 x pCO2) In this equation, pCO2 is expressed in kilopascals (kPa; typically pCO2 is 4.6-6.7 kPa). 0.23 is the corresponding solubility coefficient for CO2 in aqueous solution. Thus, the term 0.23 x pCO2 ~ 1.2 kPa. Plasma [HCO3-] is normally about 24 mM keeping blood plasma pH around 7.4.
The pH Optima of Enzymes Enzymes typically show maximal catalytic activity at a characteristic pH called the pH optimum (Fig. 2-22). Above and below the optimum pH, activity usually declines. For this reason, it is important that the pH of biological fluids such as the cytosol and blood be controlled within a narrow range. For example, in untreated diabetes mellitus, high concentrations of ketones (weak acids) accumulate in the blood, reducing its pH. Severe ketoacidosis leads to headache, drowsiness, nausea, vomiting, and diarrhea, followed by stupor, coma, and convulsions. These symptoms are caused by the disruption of proper enzyme function at low pH.
Water as a Reactant Water is a direct participant in many biochemical reactions. When a biomolecule is split apart by water, the reaction is called a hydrolysis reaction. When a biomolecule is formed from two components with the elimination of water, the reaction is called a condensation reaction. The condensation reaction in which ATP is formed from ADP and inorganic phosphate (HPO42-) is illustrated in Fig. 2-23. Biopolymers such as proteins, polysaccharides, and nucleic acids are formed and broken down by condensation and hydrolysis reactions, respectively.