Solving Agricultural Nutrient Contributions to the Gulf of Mexico Hypoxic Zone
This research study evaluates the cost and effectiveness of different conservation practices to minimize nutrient contributions to the Gulf of Mexico hypoxic zone. Using the CARD-UMRB model, various scenarios were analyzed to identify the most cost-efficient solutions. The model takes into account factors such as land use, weather, crop history, tillage, slope, and existing conservation practices. The study showcases the potential of modeling in informing policy decisions regarding water quality.

Solving Agricultural Nutrient Contributions to the Gulf of Mexico Hypoxic Zone
E N D
Presentation Transcript
Least Cost Control of Agricultural Nutrient Contributions to the Gulf of Mexico Hypoxic ZoneSergey Rabotyagov, Todd Campbell, Manoj Jha, Hongli Feng, Philip W. Gassman, Lyubov Kurkalova, Silvia Secchi, and Catherine L. Kling.Center for Agricultural and Rural Development, Iowa State UniversityOctober 2008
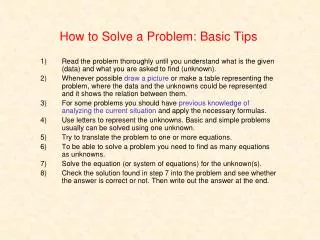
How do we solve this complex problem? • Enormous number of farm fields/decision makers • Each can have one or more land use/conservation practice • Retire land (e.g., CRP) • Reduced, mulch, or no till • Terraces • Contouring • Grassed Waterways • Nutrient management: reduce fertilizer, better timing, etc. • Costs and effectiveness of practices can vary across locations
CARD-UMRB Model: Economics, Land use, and Water Quality • Models can help answer questions, evaluate alternatives, play out scenarios that real world cannot • Model of Upper Mississippi River Basin – water quality and land use • Unit of analysis: National Resources Inventory “point” in the UMRB as unit of analysis (field) • 110,000 total “points” and expansion factors, 37,500 cropland observations • Data from many sources to describe each location: land use, weather, crop history, tillage, slope, HEL, existing conservation practices, costs, prices, yields, etc. • SWAT component • A hydrologic and water quality model developed by USDA-ARS • Watershed-scale simulation model, operates on a daily time step, assess the impact of different management practices on water quality • Gassman et al. (2007) identifies over 250 publications using SWAT • Economics component • Cost of adoption practices • Profits and revenues from alternative crops
The Upper Mississippi River Basin • 189,000 square miles in seven states, • dominated by agriculture: 67% of total area, • > 1200 stream segments and lakes on EPAs impaired waters list, • SAB Report: 43% of N and 41% of P delivered to Gulf
Using Models to inform Policy • Using a water quality model, • Evaluate water quality effects of a configuration of conservation practices • Estimate the costs of the set of practices • But how to choose which set of practices is best (and what policies would be needed to get those changes in place)? • Could evaluate lots of different alternatives to find most cost-efficient • Using water quality model, analyze all the feasible scenarios, picking cost-efficient solutions • But, if there are N conservation practices possible for adoption on each field and there are F fields, this implies a total of possible NF configurations to compare • 30 fields, 2 options over 1 billion possible scenarios
One possible watershed configuration d b c a a a d a b a a b a Genetic Algorithm lingo Field = gene Practice options =allele set watershed configuration = individual (described by set of genes) Population = set of configurations 13 Fields 4 conservation practices 134=28561 possible configurations
Algorithm flow diagram Individual = watershed configuration = specific assignment of practices to fields Population = set of watershed configurations
Fitness assignment example • Strength S(i)= # of individuals i dominates • Raw fitness R(i)= sum of strengths of individuals that dominate i
Consequences of seeking a 30% reduction in NO3 • Conservation and Land use to achieve reduction • N fertilizer reductions • grassed waterways (extensive) • terraces (combined with N fertilizer reductions) • additional (substantial) land retirement • A 30% reduction in outlet NO3 automatically leads to a 35% reduction in outlet P • The annual additional cost is estimated to be $ 1.4 billion (more than quadrupling baseline cost)
Final Remarks • CARD-UMRB model can help quantify tradeoffs between: • cost and pollution reductions • different pollutants • Many assumptions and caveats, but • The model is flexible and amenable to improvement • Need to keep in mind purpose of modeling “All models are wrong, some are useful,” George Box • Policy Role: Can we really set policy based with modeling results?? Yes and no