Download
1 / 17
180 likes | 314 Vues
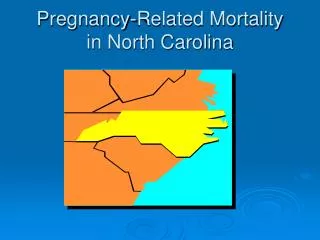
Community Level Indicators of Heat Related Morbidity in North Carolina. Maggie M. Kovach, Christopher M. Fuhrmann, Charles E. Konrad II Southeast Regional Climate Center University of North Carolina at Chapel Hill Conor Harrison Department of Geography

E N D
Community Level Indicators of Heat Related Morbidity in North Carolina Maggie M. Kovach, Christopher M. Fuhrmann, Charles E. Konrad II Southeast Regional Climate Center University of North Carolina at Chapel Hill Conor Harrison Department of Geography University of North Carolina at Chapel Hill
Previous Literature • What geographic locations are at greater risk for heat-related illness? • Urban areas are higher risk for heat illness due to higher temperatures (CDC, 2004), (Jones et al. 1982), (Harlan et al. 2006) (Reid et. al 2009) • What specific populations are at risk? • Young adults and working population experience higher rates of heat related illness in NC (Lippmann in review) • Poor, minorities, socially isolated, elderly (CDC, 2004) dailykos.com • USA Today
In urban areas, teenagers are most at risk for heat related illness, particularly during late summer heat waves Previous Literature • Are agricultural workers at greater risk for HRI? • In the US, North Carolina accounts for 57% of all heat related deaths among crop workers from 1992 to 2006 (Luginbuhlet al. 2008) • African Americans, Latino workers (Richardson and Gregory 1997, Richardson and Mirabelli 2002). • EPA Agricultural Worker Health Project : David Bacon ers.usda.gov
Data Sources http://www.mrlc.gov/nlcd2006.php
North Carolina Disease Event Tracking and Epidemiologic Tool (NC DETECT) Dates Available: 01/01/2007 – 12/31/2008 ICD 9: 992
Methodology Regression establishes relationship among a dependent variable and a set of independent variables. 1.) Transform data to a similar spatial scale. 2.) Evaluate relationship between heat-related hospital admissions and land cover & socioeconomic variables through Pearson correlations. 3.) Perform regression analysis of risk factors associated with heat-related illness. B • A Geographically Weighted Regression is a spatial regression technique that models spatially varying relationships. It generates a separate regression equation for each census tract based on the values of neighboring census tracts.
ED heat admissions for North Carolina ED HRI admission per 100,000 people N = 2590 ED Visits (Entire State) N = 2248 ED Visits (Piedmont and Coastal Plain)
Where is HRI geographically located? Urban Developed Land Rural Evergreen Land Cover *p-values < 0.05 Rural populations of North Carolina are at increased risk for heat related illness compared to urban populations.
Is poverty associated with increased HRI? Mobile Homes • With the exception of mobile homes, correlations are weak for HRI and other measures of poverty (i.e. food stamps, median income, home values below $10,000, incomes below $20,000). Census tract spatial scale
Are specific populations at greater risk HRI? Non-Citizens *p-values < 0.05 Caucasian Population • Correlations are weak for HRI and different minority populations.
Are specific farm laborers at higher risk for HRI? Results Fruits and Vegetables *p-values < 0.05 Wheat Crops Of the 30 crops examined only a few were correlated with HRI. All Crops
Geographically Weighted Regression Analysis Variables: Home values below $10,000, Rental Occupancy, Mobile Homes, Cropland (all crops) • Local R2 values: Some variables may not be globally significant, because in some regions, they are positively related, and in others are negatively related. • Local R2 values: these values range between 0.0 and 1.0 and indicate how well the • local regression model fits observed HRI admissions. In this model, the R2 predicts • up to 0.700 in particular areas .
Geographically Weighted Regression Analysis Tobacco Crops Cropland Coefficient Corn Crops • The positive relationship between crops and HRI is located in the Northern Piedmont and Northern Coastal Plain, where soybean, tobacco and cotton agriculture is located. Soybean Crops Cotton Crops
Geographically Weighted • Regression Analysis These maps display the relationship between the coefficients and HRI. Reds are positive and blues are negative. Home Values below 10,000 Coefficient Rental Occupancy Coefficient Mobile Homes Coefficient
Summary • In North Carolina, heat related illness (HRI) is found predominately in rural areas with no development, low population density, and locations with more “green space.” • Mobile homes, a proxy for rural poverty, increase a community’s risk for heat-related illness. Other indicators for poverty such as food stamps, income below $20,000 or home value below $10,000 have less influence on HRI. • No correlations were observed for minority populations and HRI. However, previous heat mortality research found that minority populations are less likely to seek care (Richardson and Mirabelli 2002). • Agriculture is positively correlated with HRI in the Northern Piedmont and Northern Coastal Plain of North Carolina, where the tobacco, cotton and soybeans are the predominate cash crops. • In the Sandhills and Southern Coastal Plain of North Carolina, socioeconomic factors such as income and mobile homes increase the likelihood of HRI.
Current Work • Incorporate NC-DETECT data for 2009, 2010 • Examine heat wave, non-heat wave heat related ED heat admissions, ages of HRI ED patients. • Incorporate climate information with individual and neighborhood risk factors to model heat risk. • Agricultural Worker Health Project : David Bacon
Acknowledgements: NC Division of Public Health NC-DETECTSoutheast Regional Climate Center The NC DETECT Data Oversight Committee does not take responsibility for the scientific validity or accuracy of methodology, results, statistical analyses or conclusions presented. Contact: mkovach@email.unc.edu