Monitoring Vegetation Ecosystems Using Interannual Multitemporal Landsat Data
150 likes | 167 Vues
Explore how NDVI and LST data from Landsat aid in evaluating vegetation health and land surface characteristics in Tajikistan. Learn about the application of remote sensing techniques for environmental monitoring in the region.

Monitoring Vegetation Ecosystems Using Interannual Multitemporal Landsat Data
E N D
Presentation Transcript
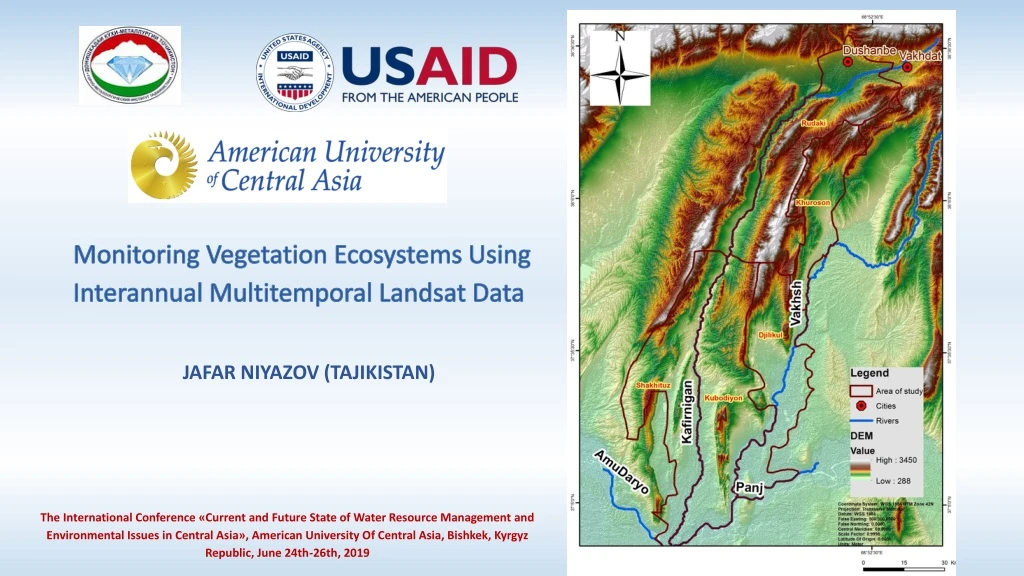
Monitoring Vegetation Ecosystems Using Interannual Multitemporal Landsat Data JAFAR NIYAZOV (TAJIKISTAN) The International Conference «Current and Future State of Water Resource Management and Environmental Issues in Central Asia», American University Of Central Asia, Bishkek, Kyrgyz Republic, June 24th-26th, 2019
To estimate vegetation according to satellite imagery, we used the so-called Normalized Difference Vegetation Index (NDVI), a normalized quantitative indicator of active biomass. As is known, the purpose of NDVI is to identify the areas covered and uncovered by vegetation, assess and monitor the state of vegetation, establish the productivity of vegetation. In relation to the study area, the following gradation of the degree of development of the green NDVI phytomass was adopted: - high - more than 0.7 - average - 0.3-0.7 - low - 0.2-0.3 When the value of NDVI < 0.1, vegetation is usually absent (bare soil, water, artificial surfaces). An unscaled discrete scale was used to display the NDVI.
The objects detection and definition on the Earth's surface useful to combine different bands to produce so-called images in natural colors or pseudo-color images. The semi-automatic extraction of objects of interest (vegetation, water bodies etc.) includes the construction of the ratio of different bands. The allocation of vegetation-covered areas by calculating the normalized difference vegetation index NDVI is widespread: For the Landsat 8 images NIR is band 5, and RED is band 4. The range of NDVI values varies from -1 to 1, with the highest values indicating lush vegetation and the lowest values indicating rare vegetation cover. NDVI values should be classified in order to clearly identify vegetation-covered areas. Should define equal values for the classified NDVI visualization separately for each satellite image scene to calculate the difference between them.
Land cover (LC) can be defined as the “observed (bio) physical cover of the earth’s surface” and is a synthesis of the many processes taking place on the land. It reflects land occupation (and its transformation) by various natural, modified or artificial systems and to some extent how these systems affect the land. LC is one of the most easily detectable indicators of human intervention on land. Because it can change quickly over time, it is also a good proxy for dynamics of the earth surface resulting from a variety of drivers and factors.
Land surface temperature (LST), a key indicator of the Earth surface energy budget, is widely required in applications of hydrology, meteorology, and climatology. It is of fundamental importance to the net radiation budget at the Earth surface and to monitoring the state of crops and vegetation, as well as an important indicator of both the greenhouse effect and the energy flux between the atmosphere and ground (Norman & Becker, 1995; Li & Becker, 1993;).
Estimation of Land surface temperature (LST), using Landsat 8 data is an important factor in many areas like climate change, urban land use/land cover, heat balance studies and also a key input for climate models. LANDSAT Data has given a lot of possibilities to study the land processes using remote sensing. The LST has been estimated with respect to Normalized Difference Vegetation Index (NDVI) values determined from the Red and Near Infrared bands.
CONCLUSION Studies carried out using NDVI and LST, based on taking into account differences in spectral reflection for different channels of the optical range, together with field-based measurements allow you to quickly identify areas of environmental stress caused by degradation of vegetation and desertification.