1 / 12

Ambient Monitoring Sites

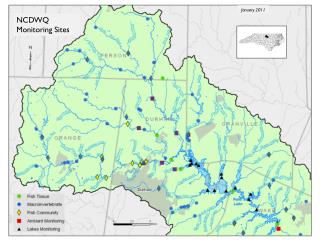
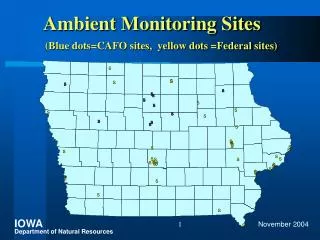
Ambient Monitoring Sites. (Blue dots=CAFO sites, yellow dots =Federal sites). Monitor Types. EPA’s Air Quality Index. AQI Levels over 100 (2004 to date). Realtime Ozone and PM 2.5 Data Reported at EPA’s AIRNOW. http://www.epa.gov/airnow.

michon
Télécharger la présentation

Ambient Monitoring Sites

An Image/Link below is provided (as is) to download presentation Download Policy: Content on the Website is provided to you AS IS for your information and personal use and may not be sold / licensed / shared on other websites without getting consent from its author. Content is provided to you AS IS for your information and personal use only. Download presentation by click this link. While downloading, if for some reason you are not able to download a presentation, the publisher may have deleted the file from their server. During download, if you can't get a presentation, the file might be deleted by the publisher.

E N D

Presentation Transcript


  1. Ambient Monitoring Sites (Blue dots=CAFO sites, yellow dots =Federal sites)

  2. Monitor Types

  3. EPA’s Air Quality Index

  4. AQI Levels over 100 (2004 to date)

  5. Realtime Ozone and PM2.5 Data Reported at EPA’s AIRNOW http://www.epa.gov/airnow

  6. Comparison of 2003 Monitored Values to Annual PM2.5 Standard (15 mg/m3 )

  7. CAFO Monitoring • 10 sites • Hydrogen sulfide, ammonia, wind speed and direction • At houses neighboring large hog, cattle, dairy and chicken confined animal feeding operations (CAFO’s)

  8. Clarion CAFO: Ammonia Data

  9. Clarion CAFO: Hydrogen Sulfide Data

  10. Chickens Data: 1/04-6/04 Blue dots: H2S Pink dots: NH3

  11. Toxics Monitoring Results: 2003

  12. Contact information • (515) 281-8923 • sean.fitzsimmons@dnr.state.ia.us • www.iowacleanair.com 

More Related