Download
1 / 30
300 likes | 598 Vues
Ambient Monitoring Networks and Monitoring Strategies. Judith C. Chow ( judy.chow@dri.edu ) John G. Watson Desert Research Institute Reno, NV, USA presented at: The Workshop on Air Quality Management, Measurement, Modeling, and Health Effects University of Zagreb, Zagreb, Croatia

E N D
Ambient Monitoring Networks and Monitoring Strategies Judith C. Chow ( judy.chow@dri.edu ) John G. Watson Desert Research InstituteReno, NV, USA presented at: The Workshop on Air Quality Management, Measurement, Modeling, and Health Effects University of Zagreb, Zagreb, Croatia 24 May 2007
Objectives • Discuss network design principles and philosophy • Define monitoring objectives • Evaluate air quality monitoring strategies
Ambient Monitoring Needs • Sampling locations that represent regional, urban, neighborhood, and source-oriented spatial scales • Sampling periods and durations that represent range of source contribution conditions • Long term record to detect trends and control strategy effectiveness • Comparability of analytical methods with source profile measurements
Statement of Problem • Many networks are designed mainly to detect maximum concentrations • Many monitoring sites measure similar concentrations and are redundant • An objective methodology is needed to design monitoring networks that represent exposure where people live, work, and play
Zones of Representation • Collocated 1 to 10 m • Microscale 10 to 100 m • Middle-scale 100 to 500 m • Neighborhood-scale 500 m to 4 km • Urban-scale 4 to 100 km • Regional-scale 100 to 1,000 km • Continental-scale 1,000 to 10,000 km • Global-scale >10,000 km
U.S. EPA’s Pyramid Approach to Air Quality • 7 Urban areas (short-term except Fresno, CA) • ~54 Trends • ~250 Source Apportionment • ~165 IMPROVE Visibility Research Supersites Assessment Chemical Speciation • ~1050 FRM • ~200 Continuous Compliance PM2.5 Mass Compliance monitoring cannot serve all objectives!
Non-urban and urban PM2.5 networks Chemical Speciation Network (CSN) Interagency Monitoring of PROtected Visual Environments (IMPROVE) Network Virgin Islands
Neighborhood- and Urban-Scale Monitoring Objectives • Determine compliance with air quality standards • Provide air quality forecasting and issue alerts • Assess source/receptor relationships • Evaluate health, radiative, and ecological effects
Urban and/or Health Network Characteristics • Multi-year duration • Urban-scale zone of representation near compromised populations • Hourly to daily frequency and averaging times • Particle concentrations by size, surface area, composition, and bioavailability • Gas and meteorological co-factors
Regional-Scale Monitoring Objectives (primary) • Determine air quality in urban, non-urban, and remote areas • Observe long-term temporal and spatial pollution trends • Monitor progress made by emission reduction measures • Conduct atmospheric process research
Regional-Scale Monitoring Objectives (secondary) • Conduct photochemical or other air quality model simulation • Relate changes in secondary pollutant concentrations to changes in precursor gas emissions
Regional Network Characteristics • Represent boundary conditions, source, and receptor areas that characterize regional-scale phenomena • Minimize influences from local sources • Include background (upwind), transport, and receptor (downwind) locations
Siting Considerations • Emission sources • Terrain • Meteorology • Population density • Existing air quality measurements
Siting Considerations • Adequate exposure – minimize nearby barriers and particle deposition surfaces • Minimum nearby emitters – monitor should be outside zone of influence of specific emitters • Collocated measurements – other air quality and meteorological measurements can aid in the interpretation of high or variable PM levels • Long-term site commitment – sufficient operating space, accessibility, security, safety, power, and environmental control
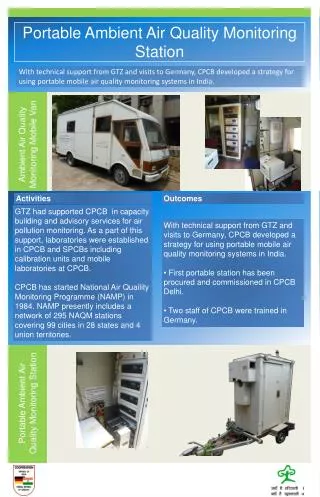
Monitoring Strategies • Level III: Portable, inexpensive filter and continuous sampling at a large number of locations with a low investment in site infrastructure and maintenance. • Hardware is already in use for indoor and exposure studies. Some accuracy and precision is traded for greater spatial coverage. Temporary, dense networks of this type surrounding Level I and Level II sites would establish the zones of representation for the permanent monitors. (NRC 2004)
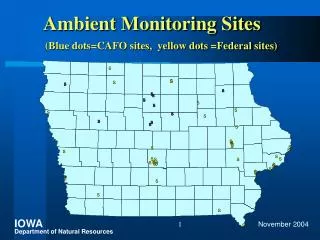
Concentration contours of average PM10 mass around the Corcoran site during the CRPAQS fall intensive (10/09/00 - 11/14/00).
Monitoring Strategies (continued) • Level II: Fixed sites with proven technology, similar to compliance sites, but with locations and observables intended to serve multiple purposes. • These would have real-time access for forecasting and episode alerts. Resources directed at urban sites no longer needed for compliance could be used to establish background, boundary, and transport sites. Discontinued Level II compliance sites could be replaced with Level III monitors to address community and environmental justice concerns.
PM2.5 Federal Reference Methods (FRMs) Partisol SamplerThermo Fisher Scientific, formerlyRupprecht & Patashnick, Albany, NY URG MASS URG Corp., Raleigh, NC Andersen RAAS Thermo Fisher Scientific, formerly Andersen Instruments, Smyrna, GA BGI PQ-200 BGI, Inc., Waltham, MA
Speciation Monitors (EPA Speciation Network) Mass Aerosol Sampling System (MASS)URG Corporation, Raleigh, NC Reference Ambient Air Sampler (RAAS)Andersen Instruments, Smyrna, GA Spiral Aerosol Speciation Sampler (SASS)Met One Instruments, Grants Pass, OR Interagency Monitoring of Protected Visual Environments (IMPROVE) SamplerAir Resource Specialists, Ft. Collins, CO
Other Speciation Monitors Partisol 2300 Speciation SamplerRupprecht & Patashnick, Albany, NY Dual Channel Sequential Filter Sampler and Sequential Gas SamplerDesert Research Institute, Reno, NV Dichotomous Virtual ImpactorAndersen Instruments, Smyrna, GA Paired MinivolsAirmetrics, Inc., Springfield, OR URG 3000NSpeciation Sampler URG Corporation, Raleigh, NC Dichotomous Partisol-Plus Sampler Rupprecht and Patashnick, Albany, NY
Monitoring Strategies (continued) • Level I: Fixed sites with proven and novel technology, similar to those of supersites. • A few of these locations would be located in contrasting environments with different sources, meteorology, and PM composition to test new technology, understand atmospheric processes, and support health studies. These would have instrumentation similar to that of Level III and Level II sites to determine comparability, as well as detailed size ranges, PM chemistry, and precursor gases. They would provide an infrastructure for the testing and evaluation of new measurement concepts and the development of procedures to implement at Level II and III sites.
Conclusions • Optimize information gained with available resources by careful network design. • Design based on existing emissions, meteorology, temporal cycles, and aerosol composition data. • Conduct short-term neighborhood-scale monitoring with densely located monitors to determine spatial representation. • Daily sampling may be needed during the most-polluted season, with less frequent sampling during other seasons.
Conclusions (continued) • Provide information to assist in control strategy development, emission tracking, trend analysis, and exposure assessment. • Maintain consistent data quality with standard calibration and operating procedures and data reporting formats. • Develop infrastructure to support long-term nationwide or regional networks.
References Chow, J.C.; Engelbrecht, J.P.; Watson, J.G.; Wilson, W.E.; Frank, N.H.; and Zhu, T. (2002). Designing monitoring networks to represent outdoor human exposure. Chemosphere, 49(9):961-978. NRC (National Research Council) (2004). Air Quality Management in the United States. The National Academies Press, Washington, DC. Watson, J.G.; Chow, J.C.; DuBois, D.W.; Green, M.C.; Frank, N.H.; and Pitchford, M.L. (1997). Guidance for network design and optimal site exposure for PM2.5 and PM10. Report No. EPA-454/R-99-022. U.S. Environmental Protection Agency, Research Triangle Park, NC. http://www.epa.gov/ttn/amtic/pmstg.html.