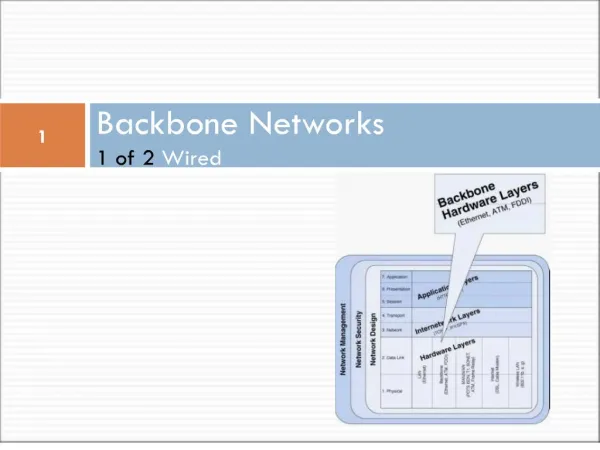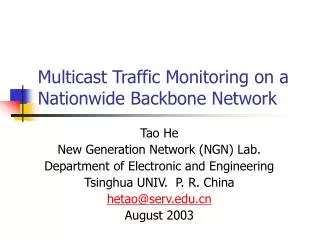
Monitoring backbone networks
Monitoring backbone networks. Manuel Șubredu , Valeriu Vraciu – RoEduNet Chișinău , September 9, 2014. Agenda. Why ? What ? How ? Tools ? Facts !. Why ?. A picture is worth a thousand words ! – Frederick R. Barnard, 20 th century. What to monitor ?.

Monitoring backbone networks
E N D
Presentation Transcript
Monitoring backbone networks Manuel Șubredu, Valeriu Vraciu – RoEduNet Chișinău, September 9, 2014
Agenda • Why ? • What ? • How ? • Tools ? • Facts ! E-infrastructure Autumn Workshop, Chisinau, September 8-11, 2014
Why ? A picture is worth a thousand words ! – Frederick R. Barnard, 20th century E-infrastructure Autumn Workshop, Chisinau, September 8-11, 2014
What to monitor ? • Backbone and critical equipment – routers, switches, firewalls, load-balancers, etc • Servers and services • Values of traffic • Error rates • Transport network equipment, if available E-infrastructure Autumn Workshop, Chisinau, September 8-11, 2014
How Always use Industry standards for collecting data like: • SNMP • NetFlow v5/v9 and IPFIX E-infrastructure Autumn Workshop, Chisinau, September 8-11, 2014
Tools • OSS Software largely available • SNMP based: • NMIS • Cacti • Weathermap • NetFlow based: • NFSEN/NFDUMP • Custom software • Maps using free API from Google Maps (CEENGINE VTR) • Maps using different technologies: JS, ActionScript, PHP, SVG, etc(RoEduNetWeatherMap) • Proprietary software • For optical network E-infrastructure Autumn Workshop, Chisinau, September 8-11, 2014
Facts forRomanian Education Network ! • NMIS: • home: https://opmantek.com/network-management-system-nmis/ • 90 routers and 20 switches monitored • Uses SNMP for collection of data • Xen based VPS - 1 x Xeon 2.4Ghz, 1G of memory, 64G of disk • OpenSuSE (64 bits) • Average load of the server – 2-3 • 3G of disk space for data since 2009 (5 years) • Requires some knowledge of Linux system and services for setup E-infrastructure Autumn Workshop, Chisinau, September 8-11, 2014
NMIS (main page) E-infrastructure Autumn Workshop, Chisinau, September 8-11, 2014
Facts forRomanian Education Network ! • Cacti • home: http://www.cacti.net/ • Uses SNMP for collecting data • Can easily monitor any OID that returns an integer (think about temperature, number of routes, etc) • Easy deployment and small requirements (web server with PHP) • Easy administration using a web interface • Authenticated access, configurable per user views E-infrastructure Autumn Workshop, Chisinau, September 8-11, 2014
Cacti (custom temperature graph) E-infrastructure Autumn Workshop, Chisinau, September 8-11, 2014
Facts forRomanian Education Network ! • Weathermap • home: http://www.network-weathermap.com/ • Uses RRDs from NMIS • Can be build using only OSS technologies like SVG and JavaScript • Is very flexible and can accommodate all kind of data visualisation • Major downside – requires some programming skills E-infrastructure Autumn Workshop, Chisinau, September 8-11, 2014
RoEduNetWeathermap E-infrastructure Autumn Workshop, Chisinau, September 8-11, 2014
Facts forRomanian Education Network ! • Nfsen/nfdump • home: http://nfsen.sourceforge.net/ • Uses NetFlow (v5 or v9) • Can have profiles of subset of data (think about graphs by service type or by IP addresses) • Supports plugins (Perl knowledge is required) • Supports alerts based on threshold or deviation from the mean • Major downside – lots of hardware needed on big networks: 1 server for data processing (8 x Xeon E7000 2.8Ghz with 64G of memory) and 22T of storage for 6 month of NetFlow’s exported by 13 core routers (8-12Gbps average traffic). E-infrastructure Autumn Workshop, Chisinau, September 8-11, 2014
Nfsen (main page) E-infrastructure Autumn Workshop, Chisinau, September 8-11, 2014
Facts forRomanian Education Network ! • CEENGINE Visual Traceroute • home: https://noc.ceengine.eu/vtr/ • Based on Google Maps • Heavy use of JS and custom web services • Backend and data collector written in Perl E-infrastructure Autumn Workshop, Chisinau, September 8-11, 2014
VTR E-infrastructure Autumn Workshop, Chisinau, September 8-11, 2014
Facts forRomanian Education Network ! • Custom maps • home: N.A. • Frontend based on JS and HTML5 • Backend uses multiple OSS services and technologies: • Lots of data input points: email, http, logs, other databases. • PostgreSQL as database server • Perl for data processing • REST API • Low hardware requirements: 1 Xen based VPS with 1 Processor and 4G or memory. E-infrastructure Autumn Workshop, Chisinau, September 8-11, 2014
Project Asgard E-infrastructure Autumn Workshop, Chisinau, September 8-11, 2014
(Extra slide – RoEduNet Optical network management) E-infrastructure Autumn Workshop, Chisinau, September 8-11, 2014
Q ? E-infrastructure Autumn Workshop, Chisinau, September 8-11, 2014