Download
1 / 36
360 likes | 451 Vues
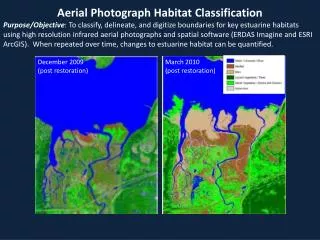
This study categorizes U.S. reservoirs based on fish habitat quality and its impact on recreational fisheries. Data analysis, cluster comparison, and empirical validation are conducted to enhance understanding and conservation efforts.

E N D
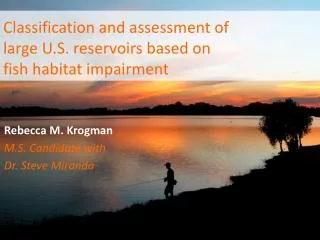
Classification and assessment of large U.S. reservoirs based on fish habitat impairment Rebecca M. Krogman M.S. Candidate with Dr. Steve Miranda
Construction of large reservoirs • “I think we all agree that the construction of reservoirs has been the greatest single contribution in this century to sport fishing and other forms of outdoor recreation.” • - Brigadier General H. G. Woodbury, Jr., US Army Corps of Engineers Background
Large reservoirs (>100 ha) National Inventory of Dams 2009
Comparison to natural lakes Background
Comparison to natural lakes Background
Fish habitat issues Delta behind Matilija Dam, California
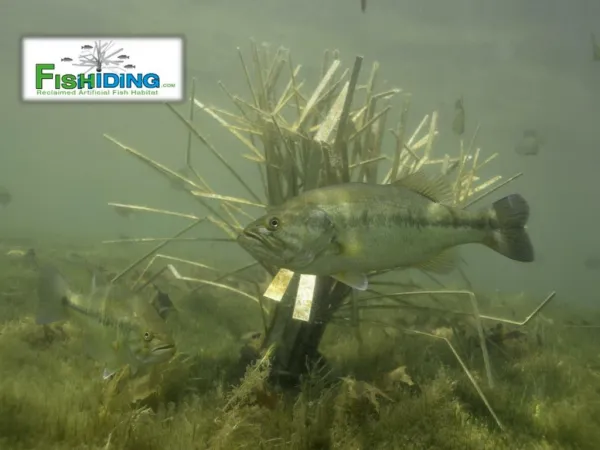
Effects on fisheries • Habitat availability • Oxygen • Structure • Connectivity • Spawning success • Change water levels • Substrate composition (e.g., gravel beds) • Siltation • Littoral zone vegetation and structure Background
Effects on fisheries • Larval fish and fingerling survival • Food acquisition • Refuge from predation • Fish productivity • Nutrient dynamics • Availability of zooplankton and macroinvertebrates • Turbidity Background
Main points • Reservoirs are numerous and ubiquitous • Reservoirs are a product of public policy • Reservoirs are aging • Habitat degradation can affect recreational fisheries
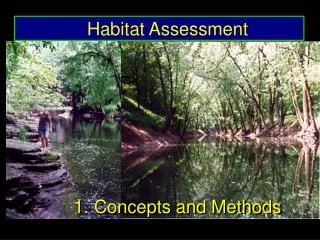
Importance Background
Previous Survey Background: Previous Survey
Variables • Suspended sediments or inorganic turbidity • Sedimentation • Shoreline erosion • Excessive nutrients • Point-source pollution • Contaminants • Oxygen or temperature stratification • Mistimed water level fluctuations • Insufficient water storage • Excessive aquatic macrophytes • Lack of aquatic macrophytes • Lack or loss of woody debris • Disconnectivity with backwaters • Invasive plant species Background: Previous Survey
Data Analysis • Factor analysis • Interpretation of primary factors and spatial variation • Development of Index of Reservoir Habitat Impairment (IRHI) • 221 respondents 494 waterbodies Background: Previous Survey
Results Background: Previous Survey
Data Analysis Background: Previous Survey
New questions • What specific variables are important in each reservoir group? • How can we determine these reservoir groups? • How do these groups relate to the recreational fishery?
Thesis Project Objectives and Methods
Objectives • Classify large U.S. reservoirs based on fish habitat impairment factors. • Validate the classification system using empirical factors not included in Objective 1. • Explore the relationship between habitat impairment and the recreational fishery.
Data Collection • Potential sites identified • National Inventory of Dams, USACE • 4,331 sites identified Objective 1: Data Collection
Reservoirs ≥100 ha in surface area Objective 1: Data Collection
Data Collection • Potential sites identified • National Inventory of Dams, USACE • 4,331 sites identified • Survey of reservoir fishery biologists • Online • Best professional judgment • Topics • Habitat impairment • Fish community • Recreational fishery Objective 1: Data Collection
Survey Design Objective 1: Data Collection
Survey Design Objective 1: Data Collection
Survey Example Based on your experience with this reservoir, please indicate the extent to which the following concerns apply to this reservoir: Objective 1: Data Collection
Survey Example Please score the following fish community and fishery characteristics in this reservoir in relation to similar reservoirs nearby: Objective 1: Data Collection
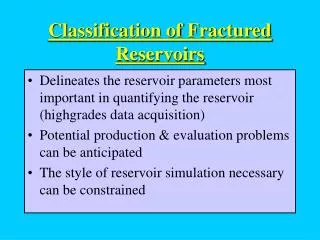
Classify large U.S. reservoirs based on fish habitat impairment factors • Cluster analysis using impairment variables • Compare clusters to existing classification systems • Select the system that is both distinct and practical • reservoir classes Objective 1: Data Analysis
Validate the classification system using empirical factors • Existing data compiled by Green and Rodgers • Basin characteristics • Local watershed characteristics • In-reservoir characteristics Objective 2: Data Collection
Validate the classification system using empirical factors • Identify the empirical variables that explain class membership • Multiple discriminant function analysis • Multinomial logistic regression • Test significance of ability to discriminate • Apply to other reservoirs Objective 2: Data Analysis
Explore the relationship between habitat impairment and the recreational fishery • Use habitat impairment variables and fishery variables • Explore several techniques for associating fishery quality with habitat Objective 3: Data Collection
Potential Techniques • Multivariate ANOVA or similar nonparametric test • Canonical correlation analysis • Weights-of-evidence and weighted logistic regression • Artificial neural networks Objective 3: Data Analysis
Artificial Neural Network Predictor variables (Habitat impairment) Response variable (Fishery quality) Objective 3: Data Analysis
Weights-of-evidence Weighted Logistic Regression Objective 3: Data Analysis
Weights-of-evidence Weighted Logistic Regression • Repeat the process of Kapo and Burton (2006) • Adjust methods for reservoirs instead of streams Objective 3: Data Analysis
Conclusion • Objective 1: Classification system • Objective 2: Validation • Objective 3: Relate it to the fishery
Potential Applications • Make quantitative comparisons among reservoirs • Understand geospatialrelationships • Guide the decision-making process Fishing below J.T. Meyers Dam Conclusions
Questions or comments? Hoover Dam