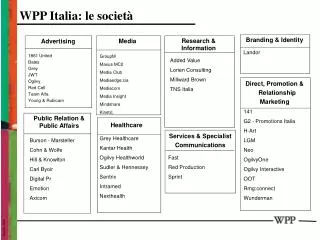
WPP
WPP. 2009 Interim Results London August 2009. 2009 Interim Results. 1. Key Priorities, Objectives and Strategy. 2. Conclusions. 3. WPP. 2009 Interim Results. 1. WPP. 2009 Interim Results. Billings up over 11% to £18.742 billion.


WPP
E N D
Presentation Transcript
WPP 2009 Interim Results London August 2009
2009 Interim Results 1 Key Priorities, Objectives and Strategy 2 Conclusions 3 WPP
2009 Interim Results 1 WPP
2009 Interim Results Billings up over 11% to £18.742 billion. Reported revenue up 28.4%. On a constant currency basis, revenue up 8.6%. Like-for-like revenue fell 8.3% and gross margin by less at 7.8%. Headline PBIT down 24.5% to £342.2m from £453.4m. Headline operating margins down 4.5 margin points to 8.0% on a like-for-like basis and down 3.1 margin points pre-severance and one-off costs.
2009 Interim Results Headline PBT down 35.2% to £252.2m from £389.1m. Tax rate on headline profits improved 2.1 percentage points to 24.8% from 26.9%. Diluted headline EPS down 40.8% to 12.9p from 21.8p. Interim dividend maintained at 5.19p per share. Estimated net new business billings of £1.208 billion ($1.872 billion).
2009 Interim Results%growth vs prior period ¹ Translated into US$, using among other currencies, average exchange rates of US$ /£ for H1 2009 of $1.493, compared to $1.974 for H1 2008. ²Figures before goodwill and intangibles charges, investment gains and write-downs, share of exceptional gains of associates, revaluation of financial instruments and gains on termination of TNS hedges.
2009 Interim ResultsUnaudited Headline¹ IFRS Income Statement ¹Figures before goodwill and intangibles charges, investment gains and write-downs, share of exceptional gains of associates, revaluation of financial instruments and gains on termination of TNS hedges ²Margin points
2009 Interim ResultsSeverance Charge of £66m ($100m) in H1 or ca 1.5% of revenue, or 1.0% margin points more than in H1 2008 Trends in Revenue and Staffing (%) Our average payment in the first half is estimated at 5 months of salary which, based on a company cost of 125%, has a 4 month payback Continuation of attrition should also support savings for H2 2009 and full year 2010
2009 Interim ResultsRevenue by Discipline ¹Gross margin -7.9% ²Gross margin -7.8%
2009 Interim ResultsRevenue by Region ¹Gross margin -7.8%
2009 Interim ResultsHeadline PBIT¹ and Margin¹ by Discipline ¹Headline PBIT/margin: profit before finance income/costs, taxation, goodwill and intangibles charges, investment gains and write-downs, and share of exceptional gains of associates
2009 Interim ResultsHeadline PBIT¹ and Margin¹ by Region ¹Headline PBIT/ margin: profit before finance income/ costs, taxation, goodwill and intangibles charges, investment gains and write-downs, and share of exceptional gains of associates
2009 Interim ResultsGrowth by Country 1 Like-for-like
2009 Interim ResultsGrowth by Category 1 Like-for-like
2009 Interim Results Effects of Sterling Weakness • Currency movements accounted for a 19.8% increase in revenue, reflecting the weakness of the £ sterling against the US dollar, the euro and the Japanese yen. • Sterling was weaker on average in the first half of 2009 than in 2008 by 24.4% against the dollar, 13.3% weaker against the euro, and 31.2% weaker against the Japanese yen. • Headline PBT¹ of £252m would have been £210m had sterling remained at the same levels as 2008. ¹Figures before goodwill and intangibles charges, investment gains and write-downs, share of exceptional gains of associates, and revaluation of financial instruments
2009 Interim ResultsTrade Estimates of Major New Business Wins Underlinedfigures are Q2 wins
2009 Interim ResultsTrade Estimates of Major New Business Wins Underlinedfigures are Q2 wins
2009 Interim ResultsTrade Estimates of Major New Business Losses
2009 Interim ResultsInternal Estimates of Net New Business Wins
2009 Interim ResultsTrade Estimates of Major New Business Wins & Losses Since 1 July WINS LOSSES
2009 Interim ResultsUses of Cash Flow ¹ Net initial payments are net of disposal proceeds and includes other investments including associates
2009 Interim ResultsNet Finance Costs/ (Income) 25.2 Gains on hedge terminations on TNS debt (25.2)
2009 Interim ResultsNet Debt - 30 June 2009 ¹ Headline PBIT: profit before finance income/ costs, taxation, goodwill and intangibles charges, investment gains and write-downs, and share of exceptional gains of associates
2009 Interim ResultsImpact of FX on debt year to June 2009 £ millions 3,752 3,447 3,068 TNS 2,221 2,172
2008 Interim ResultsOrdinary Shares - Basic -6.9% -6.7% ¹ Buy-back for cancellation
2008 Interim ResultsOrdinary Shares – Diluted -6.7% -5.3%
2009 Interim ResultsTNS Integration Consumer insight revenue growth hit by recession as elsewhere Revenue performance in line with peers Kantar GFK IPSOS Synovate Q1 (6.9) (4.6) (5.1) (9.0) Q2 (13.5) (12.0) n/a n/a H1 (10.4) (8.5) n/a n/a GM decline is lower than revenue decline at 7.8% July showed an improvement in trend and pipe line
2009 Interim ResultsTNS Integration Business reorganised into new divisions TNS/RI, Kantar Health, Kantar Media, Kantar Retail and Kantar Worldpanel Some delay on severance actions due to European regulations Synergy programme on track with workstreams indicating synergy benefits in excess of £60m Combined product and client offering more competitive than forecast Strength in technology and automotive has impacted H1 performance
Faster growing markets to be one third of total group. Marketing services including new media to be two thirds of total group. Quantitative disciplines including consumer insight to be one half of total group. Key Priorities, Objectives and Strategy
Key Priorities, Objectives and StrategyFaster Growing Markets to be One Third of Total Group Today Including Associates¹ Today¹ Tomorrow Faster growing markets including Central & Eastern Europe 27% N. America UK & Western Continental Europe Asia Pacific, Latin America, Africa & Middle East Central & Eastern Europe ¹ Based on full year 2008 reported revenue adjusted to include TNS for a full year.
Key Priorities, Objectives and Strategy WPP’s Performance Strong in BRIC Markets Revenue $’m China (including Hong Kong and Taiwan) Brazil India Russia
Key Priorities, Objectives and StrategyWPP’s Performance in Other Faster Growing Markets Revenue $’m Middle East Central & Eastern Europe Vietnam Indonesia
Key Priorities, Objectives and Strategy WPP in Faster Growing Markets 1 Source RECMA 2008 Definitive share of networks as issued July 2009. 2 Year to 30 June 2009 including associates, people at 30 June 2009. 3 Greater China is China, Hong Kong and Taiwan. 4 Includes South Africa & Middle East only. 5 WPP estimate.
Key Priorities, Objective and StrategyRevenue by Geography $15.4bn $13.4bn $7.0bn $6.9bn $2.3 bn $2.3bn ¹ 1 Source: WPP - sterling revenues converted @ $1.85= £1 based on the average for 2008, adjusted to include a full year of TNS. Omnicom, Publicis and Havas - company presentations for 2008. 2 FX. Havas and Publicis assumes $1=€0.68 based on the average for 2008. 3 OMC. Assumes “non Euro currency” Europe, ie Switzerland, Turkey, Norway, Denmark, Sweden and Eastern Europe are ca 3% of revenue and Canada is 1.5% of revenue. 4 IPG. Assumes Canada is ca 1.5% of revenue. 5Rest of World. Asia Pacific, Latin America, Middle East and Africa. 6Aegis. EMEA and Asia = $1.7 bn
Key Priorities, Objectives and StrategySlowdown in Advertising Growth 2008-2009 • Source: Summer 2009 GroupM media forecast growth projections; 2006, 2007 and 2008 are actual growth rates, 2009 are forecast growth rates. • Worldwide 2009 forecast decline of 5.5% (2008 – 2% growth). • Latin America forecast to grow by 7% in 2009. • China and India forecast to grow by 3% in 2009.
Key Priorities, Objectives and StrategyMedia Billings by Geography Worldwide ranking by Group as % of the Six Groups Source: RECMA July2009 billings report, based on 2008 data.
Key Priorities, Objectives and StrategyMarketing Services to be Two Thirds of Total Group Today¹ Today including associates¹ Tomorrow Marketing Services Advertising & Media Investment Management ¹ Based on full year 2008 reported revenue adjusted to include a full year of TNS.
Key Priorities, Objective and StrategyRevenue by Discipline $15.4bn $13.4bn $7.0bn $6.9bn $2.3bn $2.3bn ¹ Source: 1 WPP sterling revenue converted at $1.85=£1 based on the average for 2008, adjusted to include a full year of TNS. 2 2008 Company Presentations; Aegis consensus estimate. 3 Media split based on Deutsche Bank estimates. 4 FX. Havas and Publicis assumes $1=€0.68 based on the average for 2008.
Key Priorities, Objectives and StrategyQuantitative Disciplines to be One Half of Total Group ¹ ¹ Today Today including associates Tomorrow Consumer Insight andDirect, Internet & Interactive Advertising, Media Investment Management & Other Marketing Services ¹ Based on full year 2008 reported revenue, adjusted to include a full year of TNS.
Key Priorities, Objectives and StrategyWPP Position in Direct, Internet and Interactive ¹ Includes total revenue from Direct, Digital and Interactive Networks from all sources.
Improving operating margins. Increasing flexibility in the cost base. Using free cash flow to enhance share owner value, and improve return on capital employed. Developing the role of the parent company. Emphasising revenue growth more as margins improve. Improving the creative capabilities and reputation of all our businesses. Key Priorities, Objectives and Strategy We continue to focus on our key objectives
Key Priorities, Objectives and Strategy Historic headline PBIT¹ and margins PBIT1£’m PBIT1 margin % Long-term IFRS target 19% 2008 including full year of TNS 14.3% 13.6% 8.0% • Headline PBIT excludes goodwill and intangibles charges, write offs of fixed asset investments and share of exceptional gains of associates. For 2004 onwards, Headline PBIT has been prepared under IFRS. 2003 and prior periods are in accordance with previous UK GAAP.