Download
1 / 47
480 likes | 858 Vues
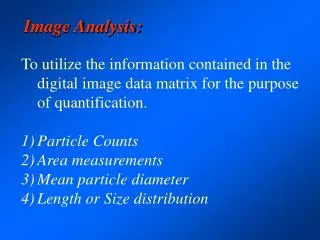
Image Analysis in Toxicology and Discovery. Frank A. Voelker, DVM, DACVP www.flagshipbio.com NIEHS Invited Presentation 2009. Topics……. Introduction Aperio Analysis Tools Concepts and Approaches Guidelines and Pitfalls Analytical Strategies Applications and using Genie™ Summary.

E N D
Image Analysis in Toxicology and Discovery Frank A. Voelker, DVM, DACVP www.flagshipbio.com NIEHS Invited Presentation 2009
Topics……. • Introduction • Aperio Analysis Tools • Concepts and Approaches • Guidelines and Pitfalls • Analytical Strategies • Applications and using Genie™ • Summary
Image Analysis Tools at Hand…… Analysis Algorithms • Positive Pixel Count • Color Deconvolution • IHC Nuclear • IHC Membrane • Co-localization • Microvessel Analysis • Micromet Analysis Preprocessing Utility Genie™: Histology Pattern Recognition From Aperio --- www.aperio.com
General Analytical Approaches……. Pixel Count IHC Deconvolution Co-localization IHC Nuclear Rare Event Membrane Angiogenesis
Two Different Approaches for Analysis Quantify Histomorphologic Change • Cellular Hypertrophy/Atrophy • Cell Numbers • Tissue Infiltrates (eg. Fibrosis) • Other Structural Alterations Usually measuring area or number Quantify Substances using Special Stains Usually measuring area and/or intensity • Histochemistry • IHC • ISH
Morphologic Approach…… Quantifying Common Microscopic ToxPath Changes using H&E or Special Stains • Liver: Hepatocellular hypertrophy, bile duct hyperplasia, necrosis, acute and chronic inflammation, extramedullary hematopoiesis, periportal fibrosis, fatty change, glycogen accumulation. • Kidney: Tubular basophilia, hyaline droplet degeneration, casts, tubular necrosis. • Spleen: Lymphoid hyperplasia/atrophy, extramedullary hematopoiesis • Lung: Alveolar edema, pneumonia, congestion. • Heart: myocardial fibrosis. • Adrenal gland: cortical hypertrophy, cortical vacuolation. • Skin: Acute and chronic inflammation, acanthosis Biggest Problem: Distinguishing target from nontarget tissue
pS6 Ser235 Immunostain of Breast Carcinoma Introducing the Concept of “Targeted Cell” Analysis Analysis of average cytoplasmic stain intensity using the pixel count tool may be useful in evaluating a neoplasm if there is little background or nonspecific staining.
Fibrosis in Livers of Zucker Rats Use of the Positive Pixel Count Tool enables “visually apparent” analysis of a change T T Fenofibrate Rat No. 5 Control Rat No. 12 T T C Pioglitazone Rat No. 3 Compound X Rat No 2 C X F P Variations in fibrosis (blue) about small portal triad veins (T) as depicted using Masson’s Trichrome stain
Quantitation of PAS Stain for Glycogen in Livers of DIO Mice Administered XXX Using the Aperio Color Deconvolution Tool Using the Color Deconvolution Tool enables quantitation of things visually obscured by counterstaining PAS-stained Section Aperio Markup Image
Cyclin D1 Immunostain of Human Breast Carcinoma Use of the IHC Nuclear Analysis Tool to Determine Percent and Degree of Positivity of Neoplastic Cell Nuclei. Stromal Nuclei are Excluded from Evaluation.
Quantifying Inflammation in Tissue using the Nuclear Analysis Tool… Different cell types often can be distinguished from each other in the same tissue based on nuclear diameter. Here lymphocyte nuclei are smaller than mammary carcinoma nuclei. This makes it possible to count lymphocyte numbers per unit area of tissue cross section to determine degree of infiltration. Algorithm: IHC Nuclear (cell-based)
Mouse Liver - Hepatocellular Hypertrophy Total Hepatocyte Nuclei = 199 Average Nuclear Size =140 µm² 706 nuclei/mm² Total Hepatocyte Nuclei = 167 Average Nuclear Size = 160 µm² 508 nuclei/mm² Algorithm: IHC Nuclear (cell-based)
Some Guidelines for Analysis of Slides from Experimental Studies • Take care to assure immediate optimal fixation for all tissue samples. Uniformity of handling as well as fixation time is important. • Staining procedures for all slides in a study need to be performed simultaneously in a single batch to assure uniformity of stain. • Sampling must be strictly representational as well as consistent. Care must be taken to assure exact uniformity of analysis with respect to anatomical location (eg. Tissue trimming, sectioning) • A preliminary evaluation of image analysis tools between some slides of varying stain intensities will help assure that analysis values are established optimally for all slides in the study.
Consistency of Sample Area Selection for Morphometric Analysis within the Median Lobe of the Mouse Liver 1 2 3 Select samples within approximately the same region of the same lobe of the liver for consistency of analysis. As an assurance of sampling homogeneity, areas should have roughly similar pixel count values.
Sirius Red Stain Depicting Myocardial Fibrosis in a Mouse Analysis Tool: Color Deconvolution (area-based) Precision in level of section is required for accurately comparing amounts of fibrosis between treatment groups
Consistency of Study Conditions can Affect Morphometric Analysis Variations in duration of fasting prior to necropsy can result in large differences in hepatocellular glycogen thus leading to inaccurate analysis 212 nuclei/mm² 263 nuclei/mm² Mouse Livers
Three Possible Strategies for Measuring Brown Stains using the Positive Pixel Count Analysis Tool • Quantitate the percentage area of all brown pixels in the section or in selected areas of the section. • If the chromagen staining is very extensive in the target cell population, measure only the brownest (darker) pixels in selected areas of the section. • If the chromagen staining is uniform in character and very extensive in the target cell population, measure stain intensity as an index of concentration.
Percent of Liver Tissue Staining for Transferrin Receptor(CD71) in Female Mice by Immunohistochemistry Measuring all of the brown pixels in the sample area ** % * Control 100 mg/kg 250 mg/kg 1000 mg/kg * p .01 **p .001
Cytochrome p450 Reductase Immunostaining of Centrilobular Hepatocytes Widespread staining with centrilobular distribution of more intense staining
Quantitation of Cytochrome p450 Reductase Immunostaining of Centrilobular Hepatocytes by Aperio Original Image Markup Image Measuring only the area of more intense stain Color deconvolution (area-based)
Quantitation of VEGF Immunostaining in Livers of Mice administered XXX for 52 Weeks Control Females Control Males 1000 mg/kg Males 1000 mg/kg Females Comparing stain intensity
Fibrosis in Livers of Zucker Rats T T Fenofibrate Rat No. 5 Control Rat No. 12 T T C Pioglitazone Rat No. 3 Compound X Rat No 2 Variations in fibrosis (blue) about small portal triad veins (T) as depicted using Masson’s Trichrome stain
Percent of Cross-sectional Liver Area of Zucker Rats Occupied by Hepatocellular Fibrosis Percent Area Positive Pixels (ie. Fibrosis) Percent Staining * * * Vehicle Control Fenofibrate Compound X Pioglitazone *P ≤ 0.05
bFGF Immunostaining in Livers of Mice Administered Compound xy for 52 Weeks 1000 mg/kg Male 2068 Positive staining in a minority cell type (Kupffer cells in this case) may lead to low percentage values that are highly variable.
PTEN Immunostain of Squamous Cell Carcinoma in Human Lung The Problem of Nontarget Tissue Staining Nonspecific staining of surrounding stroma can make analysis of marker in neoplastic target tissue difficult.
pS6 Ser235 Immunostain of Squamous Cell Carcinoma in Human Lung Analysis of Average Stain Intensity in Target Tissue Estimation of Average stain intensity should take into account negative-staining regions of target tissue as well as positive-staining regions
“H” Scoring is a Convention for Determining Average Stain Intensity of Target Tissue • With the old subjective scoring method, the pathologist visually scored staining features of cells (eg. cytoplasmic, nuclear, or membranous staining) by intensity of stain according to grades 0, 1+ , 2+ or 3+ using the following formula: • (1)x(%1+)x(%Area) + (2)x(%2+) x (%Area) + (3)x(%3+)x(%Area) = “H” Score (For a maximum of 300) Now “H” Score evaluation is automatically calculated in Aperio’s IHC Deconvolution Algorithm using attribute outputs in the following similar formula: (Nwp/Ntotal)x(100) + Np/Ntotal)x(200) + Nsp/Ntotal)x(300) = “H” Score Where: Nwp = Number of weakly positive pixels Np = Number of moderately positive pixels Nsp = Number of strongly positive pixels Ntotal = Total number negative + positive pixels Not available with IHC Nuclear and Membrane Algorithms
Genie™…….. Introducing the concept of using histology pattern recognition software as a preprocessing machine to segregate target from nontarget tissue during analysis • Recognizing the importance of Object Recognition in the future of image analysis, Aperio has recently obtained an exclusive worldwide license from Los Alamos National Laboratory (LANL) for the use of LANL’s Genetic Imagery Exploration (Genie™) image pattern recognition technology in the digital pathology market. • Object recognition software components of Genie™ have been incorporated into specific ScanScope image analysis algorithms for the 10.0 release (GLP compliance and object recognition) • The structure of this incorporation has been designed to meet the needs of the pathology and image analysis community, but it will continue to evolve based on developing needs.
Tumor Cell-Specific Biomarker Analysis using Genie Histology Pattern Recognition Software Genie mark-up image. Tumor cells = blue Pulmonary adenocarcinoma stained for pS6-Ser240 IHC nuclear analysis of tumor cells Positive pixel count analysis of tumor cells
Immunostain Analysis of Human Breast Tumor Tissue Micro Arrays Multiple Genie™ Training Classifiers may be needed in analysis of a TMA slide because of tumor heterogeneity.
Tumor Cell-Specific Biomarker Analysis of TMA Breast Tumor Samples using Genie Histology Pattern Recognition Software IHC Genie Mark-up Positive Pixel Mark-up
Uniform Analysis of Study Samples is Obtained Despite Using Multiple Genie™ Training Classifiers Morphologically Variable Samples Trained Individually for Genie Target Tissue Selection Targeted Tissue Selection and Isolation by Genie™ Subsequent Uniform Analysis of Isolated Target Tissue for area/intensity Separate target tissue training of each sample does not affect final target tissue analysis.
Quantitation of Splenic Extramedullary Hematopoiesis in a Mouse using Genie™ and the Aperio Positive Pixel Count Tool Genie™Markup Image H&E Stain Positive Pixel Markup Image Results: EMH comprises 50.2% positive pixels in evaluation area
Quantitation of Periarteriolar Lymphoid Tissue in a Mouse Spleen using Genie and the Aperio Positive Pixel Count Tool H&E Stain Genie Markup Image Aperio Positive Pixel Markup Image Result: Lymphoid tissue comprises 30.1% of positive pixels in splenic cross-sectional area Extrapolating to an entire tissue section demands more robust training than for a simple image.
Bile Duct Hyperplasia in Rat Liver First pass Genie histology pattern identification with minimal training. Genie™ can simultaneously analyze three or more tissue areas Hyperplastic Bile Ducts = Green Hepatic Parenchyma = Red Periportal Inflammatory Cells = Blue Periductal Collagen = Brown Bile Duct Lumena + Sinusoids = Yellow Then analyze up to three tissue areas using colocalization tool
Quantitation of Hepatocellular Necrosis Use of Genie™ as a preprocessing utility to identify regions of hepatic necrosis (red) and areas of normal liver (green) Subsequent quantitation of necrotic areas using a pixel count tool to allow precise grading
Using Genie™ to Discriminate Between Nuclear and Cytoplasmic Markers Human Breast Carcinoma Stained for Estrogen Receptor The ability of Geni to discriminate between nuclear and cytoplasmic regions of a neoplasm allows separate biomarker intensity measurement for both nuclear and cytoplasmic markers.
Cynomolgus Monkey Lung Use of Genie™ as a preprocessing utility to identify regions of smooth muscle (green) Subsequent quantitation of pulmonary smooth muscle using a pixel count tool
Cynomolgus Monkey Lung Use of Genie™ as a preprocessing utility to identify regions of bronchiolar epithelium (green) Subsequent isolation and analysis of only bronchiolar epithelium using the positive pixel count or other analysis tool
Islet Cell Mass of Mouse Pancreas Measurement of Pancreatic Islet Cell Mass using Genie™ Followed by the Colocalization Algorithm (A/B)C=Islet Cell Mass A=Total Islet Area in Section B=Total Pancreas Area in Section C=Pancreatic Weight
Quantitating Dog Thyroid Gland Tissue Components Use of Genie™ as a preprocessing utility to identify thyroid gland follicular epithelium (green), colloid (red) and C-cells (blue) Then quantitate each separate tissue component area using the colocalization tool.
Measuring Cellular Hypertrophy of two cell types in a Dog Thyroid Gland Apply colocalization algorithm to calculate respective areas of brown follicular epithelium and blue c-cells.each. Then apply IHC nuclear algorithm on same image to get numbers of artificially colored brown and blue nuclei. Total Brown Area/Total Brown Nuclei = Mean Follicular Cell Area. Do same calculation for blue nuclei.
Summary • The ability to digitize entire slides and perform morphometric analysis on images has been valuable in allowing the rapid and practical measurement of tissue biomarkers for pharmaceutical research and development. • A number of strategies and examples have been presented for using various image analysis algorithms in the measurement of tissue changes and tissue biomarkers. Image analysis of specific target tissues can be particularly challenging in cases with large and morphologically intricate areas of tissue, or when tissue staining is nonspecific. • Genie™, a histology pattern recognition tool, has been introduced as a preprocessing utility capable of identifying and categorizing specific histologic tissue types, thus allowing subsequent analysis of target regions by standard image analysis tools. • Significant challenges remain in developing practical procedures and methods appropriate for the analysis of oncology and toxicology specimens. Recent object recognition advancements may assist in this effort.
Acknowledgements • Ms. Kimberly Merriam, TBG, BMD Novartis • Ms. Jeanette Rheinhardt, TBG, BMD Novartis • Dr. Allen Olson, Aperio Technologies, Inc. • Dr. Kate Lillard-Wetherell, Aperio Technologies, Inc. • Mr. James Deeds, Oncology Research Novartis • Dr. Rudi Bao, Oncology Research Novartis • Dr. Humphrey Gardner, TBG, BMD Novartis • Dr. Alokesh Duttaroy, DMDA Novartis • Dr. Steve Potts, Aperio Technologies, Inc • Dr. Reginald Valdez, Novartis • Dr Oliver Turner, Novartis • Others
Frank VoelkerDVM MS Diplomate ACVP Flagship Biosciences LLC was created by industry leading molecular pathologists to fill the growing need for advanced digital technology in drug development and medical devices. Our pathologists deliver quantitative results so our customers can make efficacy and toxicology assessments faster. Contact me via email at: frank {at} flagshipbio.com Boulder, Colorado