Integrating the 4Ds in Travel Demand Models: Key Insights for Planners
340 likes | 470 Vues
This presentation by Don Hubbard, AICP, PE, explores the crucial role of the 4Ds—Density, Diversity, Design, and Destinations—in shaping travel behavior and enhancing travel demand models. It discusses the limitations of conventional models in adapting to changes in 4D characteristics, illustrated by a case study from Sacramento. The talk emphasizes the importance of incorporating these elements into modeling methodologies to improve accuracy and outcomes in transportation planning, presenting methodologies for quantitative forecasting and evaluating Smart Growth strategies.

Integrating the 4Ds in Travel Demand Models: Key Insights for Planners
E N D
Presentation Transcript
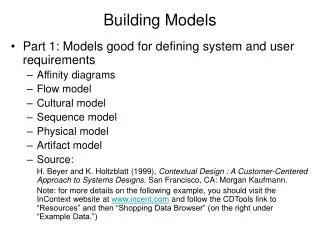
Building the 4Ds intoTravel Demand Models Don Hubbard, AICP, PE Senior Associate
Topics Covered • What are the 4Ds and why are they important? • Insensitivity of conventional models to changes in 4D characteristics • Adjusting a model to reflect the 4Ds – a case study from Sacramento • Potential improvements to the methodology • Conclusions – What does it all mean?
What are the 4Ds? National research has found that certain characteristics of the built environment tend affect travel behavior in predictable ways. These characteristics are: • Density in terms of dwelling units or jobs per acre • Diversity of land uses within any given area • Design of the pedestrian and bicycling environment • Destinations; proximity to regional activity centers
Why Are They Important? Because they affect per-capita auto use Sources: 4D National Syntheses, Twin Cities, Sacramento, Location Efficiency
… and (on a different level) because they have entered public debate • Growing consensus that highway construction does not solve congestion problems in the long term • Prominent groups (APA, FHWA) are supporting Smart Growth as a way to reduce the demand for road space as an alternative to increased supply • Transportation planners are being asked to analyze these potential reductions
Insensitivity of Conventional Models to Changes in 4D Characteristics
“Blind Spots” in Conventional Models – Walking Trips • Walking trips must use road links, and only roads big enough to be in the traffic model • Sidewalk completeness and other aspects of sidewalk condition (shade, aesthetics, etc.) are ignored • Intra-zonal and adjacent-TAZ trips (the most important for walk mode) are handled very abstractly
“Blind Spots” in Conventional Models – Land Use • No consideration is given to the distances between land uses within a given TAZ • Interactions between different non-residential land uses (e.g. offices and restaurants) not well represented • Density is ignored (a TAZ with a dense development in one corner is treated the same as a TAZ with the same population spread evenly throughout its area)
Consequences of the“Blind Spots” • Model tests of Smart Growth policies usually understate benefits; things that cannot be measured tend to be ignored • Planners are frustrated by model results that do not match field experience • But if they reject the model’s results, then land use planning and transportation planning proceed on separate tracks Blind spots in models affect real-life choices; correcting the models will reduce the distortions in the project mix
Adjusting a Model to Reflect the 4Ds – A Case Study in Sacramento
4D Applications Already Done • Atlanta (Atlantic Steel Site) • Twin Cities • East Bay (TBart) On-Going Projects • Humboldt County • San Luis Obispo COG
Background • SACOG initiated a public visioning process for the long-term future of the Sacramento Region • Smart Growth policies were prominently featured in the debate • However, the regional model (SACMET) was insensitive to 4D characteristics • The model needed to be augmented to enable quantitative forecasts of the effects of smart growth policies in different scenarios
Approach Used • 4D adjustments were computed as elasticities (each % change in neighborhood characteristics resulted in a certain % change in travel behavior) • % changes based on differences from a Base Case • These adjustments were applied to outputs from the SACMET model
Adjustment Methodology The 4D adjustment component is shown in blue
Data Sources • VT & VMT data came from a large (4,000 HH) travel diary survey • Households, jobs, and developed acres came from a parcel database (400,000+ parcels) • Sidewalk coverage and route directness came from aerial photographs
Regression Analysis Different formulas were used for different trip purposes Some values were not statistically significant HBW was the least elastic NHB proved to be the most elastic
Problems Encountered • Some of the relationships were not statistically significant Drop any below 90% significance • Elasticity approach does not work well at the extremes (vacant-to-non-vacant) Use floor and ceiling values to keep results within actual experience in region • Adjustment process very labor-intensive Automate data processing
PLACE3S Used for Land Use Data Parcel-level data collected for all of Sac County • Four land use scenarios: • Current Trends • Increased Density • Density with Smart Growth • Land Use Balance Two transportation networks (current trends and Smart Growth)
Scenario Themes • Base Case – Continuation of current trends; • Density (only) – Build to highest densities allowed under existing general plans for residential uses • Density with Smart Growth - Most regional growth goes to compact, centrally-located transit- and bike-friendly communities. A widespread BRT system replaces limited LRT line extensions • Land Use Balance - Sac County broken into ten areas, each with a good balance of residential, retail, and non-retail land uses In each case regional population will approximately double (from 1.2 million to 2.4 million)
Results – Regional Auto Use % Change from Existing When population doubles, there will be a big increase in auto use under any scenario But 4D model shows smart growth policies could reduce the growth significantly
Results – Transit Mode 4D characteristics (especially density) make a big difference in transit use that a conventional model might miss
Results – Non-Motorized Modes Again, density and walkable design have major impacts on the walking mode that would not be detectable using a conventional model
Mode Split for Sac County 4D model does not forecast the demise of the auto mode, even under the most aggressive scenario. But it does suggest that a more balanced mode split is achievable in Sacramento
Base the regressions on fixed radii rather than TAZs TAZ boundaries tend to separate land use types Fixed radii more accurately reflect field conditions Each TAZ’s land use seems to be poorly balanced Also, less arbitrary and more transferable
Shift the Adjustment to an Earlier Stage of the Model Upstream adjustment means that the assigned volumes reflect the adjustments Post-processing means that link volumes cannot reflect 4D affects
Develop Elasticities for the Attraction End of the Trip Conditions at both ends affect travel behavior
Develop a 5th D Related to Transit Accessibility • The Sacramento Case had a very simple mode split component • Reductions in VT were assumed to shift to transit or walk/bike • Split between transit and walk/bike based on split in SACMET model (which differs for each TAZ) • Next generation will use elasticities based on characteristics of the neighborhoods around stations
Develop Elasticities for Other Cities • Sacramento had the first elasticities by trip purpose; difficult to gauge transferability • Regional differences may be significant (especially the effect of winter on walking) • City size may also be significant • Ultimately would like to have values usable (as a first estimation) without local surveys
What Does It All Mean? • Conventional traffic models were not intended to measure the issues inherent in Smart Growth • Tests using conventional models tend to show that Smart Growth policies would have few benefits; but field experience suggests otherwise • We now have a method to make forecasts more sensitive to Smart Growth policies • So cities are now able to have more enlightened analysis of Smart Growth