Download
1 / 8
80 likes | 183 Vues
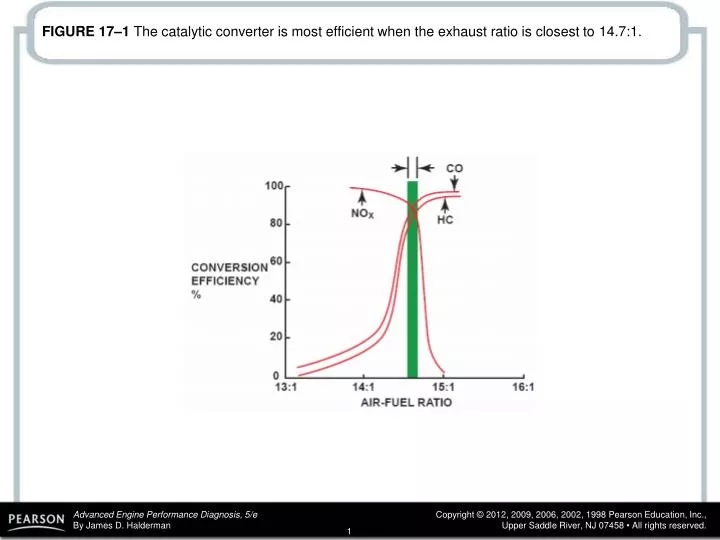
FIGURE 17–1 The catalytic converter is most efficient when the exhaust ratio is closest to 14.7:1. FIGURE 17–2 Shown is lambda. The equivalence ratio is opposite lambda. FIGURE 17–3 Scan tool display, showing both long-term and short-term fuel trim. Both LTFT and STFT should be less than 10%.

E N D
FIGURE 17–1 The catalytic converter is most efficient when the exhaust ratio is closest to 14.7:1.
FIGURE 17–2 Shown is lambda. The equivalence ratio is opposite lambda.
FIGURE 17–3 Scan tool display, showing both long-term and short-term fuel trim. Both LTFT and STFT should be less than 10%.
FIGURE 17–4 Any fault in the air cleaner assembly can disrupt the airflow through the MAF sensor.
FIGURE 17–5 This properly operating engine is drawing in 48 grams per second of air for all eight cylinders. This indicates that each cylinder will be receiving 6 grams per second (GPS).
FIGURE 17–6 If the exhaust system on the left bank (bank #1) were to become restricted, the total airflow through the MAF sensor would also decrease. The cylinders on the right bank (bank #2) would draw the same 6 GPS as before and the cylinders on bank #1, which have a restricted exhaust, would draw just 4 GPS.
FIGURE 17–7 If all cylinders were equal and showed the 40 grams per second, then each cylinder will be drawing 5 grams per second (5 x 8 cylinders = 40 GPS). Bank 1 is being supplied 4/5ths of the air needed whereas bank 2 is being supplied 6/5ths of the air needed causing bank 1 to operate too rich and bank 2 to operate too lean.
FIGURE 17–8 As a result of the restricted exhaust on bank #1, the restricted bank will operate too rich and bank #2 will operate too lean. The long-term fuel trim will be negative for bank #1 and positive for bank #2.