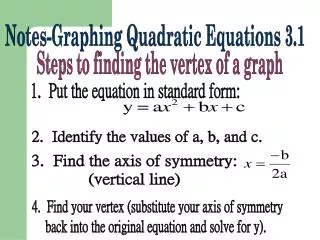
Graphing Notes
Graphing Notes. Graphs are used to show the results you obtained from an experiment. When you draw a graph, put the independent variable on the x-axis (horizontal axis) and put the dependent variable on the y-axis (vertical axis).

Graphing Notes
E N D
Presentation Transcript
Graphs are used to show the results you obtained from an experiment. • When you draw a graph, put the independent variable on the x-axis (horizontal axis) and put the dependent variable on the y-axis (vertical axis). • The title must go at the top of the graph and be detailed enough to describe what is being shown on the graph.
Changes in Speed over Six Seconds title Dependent variable Independent variable
1. Bar Graph: page 136 • Uses bars to show the number of separate categories. • Used to show comparisons between sets of data.
Example: Which bird seed does the bird species feed on the most? • What is the Independent Variable? Seed type • What is the Dependent Variable? Number of species
2. Line Graph: page 137 • Uses lines to show the relationship between the independent and dependent variables. • Used to show how the dependent variable changes in response to the independent variable.
Example: • What is the Independent Variable? Time in minutes • What is the Dependent Variable? Number of students able to locate suitable materials
3. Circle Graph: page 138 • Used to show parts of a whole • Data is usually expressed as a percent • It does NOT show change over time
Line Graph Graphing Steps • Draw the x and y-axes using a ruler. • Label the x-axis with the name of the independent variable. Label the y-axis with the name of the dependent variable. Be sure to include units of measurement on each axis. • On each axis, create a scale by marking off equally spaced intervals that cover the range of values you will be showing. Both scales should begin with zero. Be careful that you make each line on the graph paper worth the same amount. Use as much graph space as possible. • Plot a point for each piece of data. • Connect your points using a ruler. • Give your graph a descriptive title. You do not need to put any units in your title. Pages 70-71 in the “Nature of Science and Technology” textbook shows you pictures of how to complete each step if you get stuck.