Download
1 / 35
350 likes | 472 Vues
Tomographic Imaging of the Crust and Upper Mantle in the Southern Great Basin - Interpretation. Glenn Biasi University of Nevada Reno Seismological Laboratory. Method and Source Data. Data – Relative teleseismic travel-time delays Invert by projecting delays on the ray path

E N D
Tomographic Imaging of the Crust and Upper Mantle in the Southern Great Basin - Interpretation Glenn Biasi University of Nevada Reno Seismological Laboratory
Method and Source Data • Data – Relative teleseismic travel-time delays • Invert by projecting delays on the ray path • Preferred regional model 450x450x300 km – 15x15 km blocks of variable thickness. • Local model: 4.5x4.5 km blocks Inversion: SIRT, with back-azimuth binning and model updates damped inversely to the hit count. Fit explains 75% of the model RMS (0.23 sec.); model slowness rms: 0.95 sec/km. 90 stations, >7700 travel-time delays
Station Coverage Note station coverage north, east of the TM/SC Caldera Complex 90 stations total Portable stations supplement analog and digital coverage around Yucca Mountain
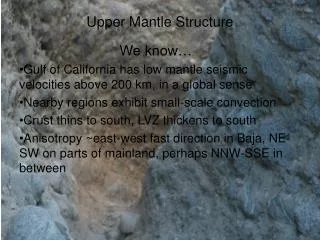
Velocity Scaling Relationships • Factors: Temperature, composition (degree of depletion), melt fraction, and degree of hydration • UM near solidus – temperature variations likely are small < 100 degrees C, <1-2% dVp • Composition: A small effect. (Schutt and Lesher, 2005)dVp < 0.7% for depletion < 20% (cpx out); to 2.5% at 40%. • Velocity very sensitive to retained melt fraction F (Hammond and Humphreys, 2000): –3.6% dlnVp/dF • Hydration • Subsolidus: OH in UM decreases velocity, shear strength • Hypersolidus: water escapes to melt -> velocity increase at low retained melt fractions. Volcanism dries, cools, source -> farther from solidus. Melt retention decrease velocities.
Resolution – Point anomaly Reconstruction Blocks at 50-70 km reconstructed at ~30%; 40% at 90-120 km Map view (NS, EW) resolution excellent.
70-90 km • Slight depression in velocity evident connecting Crater Flat to Thirsty Mountain. • 2-5 Ma centers concentrated in 0 dV ring.
Shallow Mantle YM is on the velocity contrast <5 Ma basalts concentrate at 1/2% to -1/2% dVp 50-70 km: TM high velocities become clearer; structure divides the Death Valley- Pancake Range lineation. NE low velocity trend clear, south half amagmatic
Regional Tomographic Interpretations • TM/SC caldera complex caps a depleted hydrous melt ascent column. • 2-3% high velocities due to dehydration, cooling, melt loss. • Basaltic volcanism follows the margins of the larger root. Model: residual volatiles +/- heat trigger volcanism. Waning volumes reflect depletion of volatiles (e.g., Crater Flat). • Large NE-trending low-velocity interpreted as hydrated, warm, sub-solidus. • Melt (>1%) should have some surface expression • Low melt fractions and dry would not explain spatial correlation with shattered zone in Miocene tuffs and Paleozoic rocks.
Detailed Model • 4.5x4.5 km blocks, 80 km total model depth. • Station corrections from refraction velocity models. • Shallow regional model is consistent at similar wavelengths. • Interpret for spatial patterns; locally amplitudes may be excessive.
Local Model Red line bounds areas with crossing ray coverage. CAF: base of the Calico Hills; LC: Lathrop Cone; LSM: Little Skull Mntn Velocity amplitude plot clipped at +-3% - in crust variation can be silica content
Local Model, 20-45 km depths -- Shallow mantle depth low velocities S, SE of LSM may be crustal in origin. -- Suggested Moho topography east of the Bare Mountain fault. -- The ESF is underlain by higher than background velocity crust. -- Resolvable structure separates ESF from North CF cone. -- NNE trend through Crater Flat – UM weak zone
Local Model, 45-80 km Source depth for Crater Flat, Lathrop inferred at 50-60 km at velocity increase. Shallow mantle not homogeneous
North-South Profiles, West of YM Source areas suggested at 50-60 km Melt, water extraction leaves above background velocities
- High velocity crust, upper mantle under YM • Geometry suggests intrusion or metamorphic • grade increase, Timber Mntn source • Low vel. in S. half of Jackass Flats • Anomaly B source not clear.
Interpretations and Conclusions - Root • P-wave tomography provides the third dimension – the upper mantle today – with useful resolution. • Root structure separates volcanism north and south of Timber Mountain. • Hydrous root may explain unique regional isotopic characteristics and extensive metasomatism. • Not a simple subduction enrichment • Provides hydrous alternative to extreme melting temperatures of Wang, Smith, et al. (2002). • Apparent ancient lithospheric Nd, Sr signature may originate with enrichment source – perhaps water collected on the 410. • Dry, strong root may protect crust from extension, extensional faulting • Near-vertical alignment precludes post-12 Ma (post-15 Ma?) crustal displacement relative to mantle
Interpretations and Conclusions – Location of Basaltic Centers • Quaternary volcanic centers overlie edges of TM/SC U.M. structure – Not spatially random. • Outward diffusion, possible upward mobility of water leads to hydrous “halo”. • Melting occurs locally where additional water lowers melting point. • Melt volume intrinsically limited by water incompatibility and loss with melt. • Appears compatible with polybaric melting hypothesis - water in the garnet lherzolite field is lost to small melt fractions but picks up garnet melting signature. Shallower melting increases FeO and SiO2. • Image suggests a shallow source for the basalts of Buckboard Mesa. Petrology may support this inference.
Melting Depth and Mantle Heterogeneity • Melting depth appears imaged in Crater Flat, Yucca Mountain areas. • Melt, water removal increases velocities • Should be compared with petrologic estimates • May be directly testable with Vp/Vs ratios • Deep crust and shallow mantle are not homogeneous beneath Yucca Mountain or Crater Flat. • PVHA impact on spatial probabilities of future activity. • Shallow high velocity under Yucca Mountain • No special low velocities in Crater Flat (c.f., Evans interpretation). • NNW tectonic trend through W Crater Flat follows mantle low Vp lineation from Crater Flat to Thirsty Mountain • Lowest velocity upper mantle interpreted as warm, subsolidus, partially water saturated. • Low velocity extends to eastern edge of images. • West half is amagmatic, north and east are covered with shattered Miocene and older rocks. Apparently no Quaternary basalt.
Ray Angles in the Upper Mantle • Core phases provide lateral constraint • Near tele’s constrain depth • Rays are traced in model but angles change little in the U.M. • Most rays at 300 km sample 100 to 170 km from the station
Composition • Schutt and Humphreys (2005): • spinel lherzolite (shallowest mantle) dVp < 0.7% until cpx exhausted, can reach 2.5% for 40% melt extraction. • garnet lherzolite (>2-3 Gpa) dVp < 0.5% for depletion to 40% • dVp/dVs > 1.8 is diagnostic of melt presence. • Result: little of dVp is due to modal change from depletion.
Velocity Sensitivity to Melt and Hydration • Hammond and Humphreys (JGR, 2000) – velocity decreases sharply with increasing melt fraction in realistic geometries • 1% melt, 3.6% dVp, 7.9% dVs Dry melting only. • Melt interconnects at small fractions (<1%, maybe 0.5% or less) • Lowest dVp < ~4% - suggests a 1% upper bound on melt fraction in area imaged by upper mantle tomography • H&H model: 2% melt, ~10% decrease in velocity for (T-Ts)=10 degrees C • dln(Vp)/dln(Vs) (ratio of percent dV’s) diagnostic of melt presence. • Karato and Jung (1998) velocity increases when small fraction partial melt is present • Water incompatible, partitions into melt • Water in melt = water not in crystals • Water-free crystal matrix faster as a result. • Limited to low melt fractions • Connectivity at low melt fraction promotes melt loss; residuum higher velocity after melt removal. • Could explain neutral velocities under modern caldera (Long Valley)
120-150 km • Timber Mountain root is well defined • Low-velocity region is wider and lower amplitude.
150-180 km • Little changed from 120-150 km layer.
180-210 km depth • Root is 1-2% above average velocity; 2-3% with approximate amplitude correction • Root is ~30 km north and 0-15 km east of surface edifice – no strong crustal shear.
210-250 km depth • At 210-250 km the root is ~95 km EW by 105 km NS. • Shallowest maximum depth to the base of the root is over 200 km. • Slight north plunge from Moho to this layer.
250-300 km depth • NE plunge begins
300-350 km depth • High velocity body remains coherent • Amplitudes max at base of model indicate that the true source could be deeper.
350-400 km • Amplitude of NE structure and lack of this body in realistic synthetic models indicates high velocities are real, if ill-resolved.
Squeezing: Estimating Required Model Depth • Method: decrease model depth until misfit suffers and/or imaging artifacts or unphysical amplitudes result • Amplitude vs. model depth: deeper => smaller average block amplitude. • RMS misfit vs. model depth: deeper models fit better • Spatial distributions of structure unaffected by model depth.