Download
1 / 8
90 likes | 116 Vues
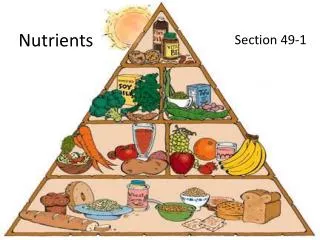
Understand the crucial relationship between plant growth and soil nutrient supply to achieve maximum yield. Explore Mitscherlich's theories, laws of diminishing returns, and the impact of immobile and mobile nutrients on crop productivity.

E N D
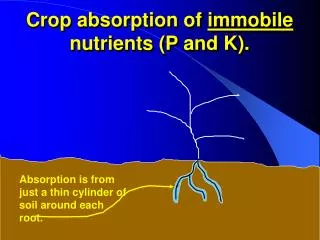
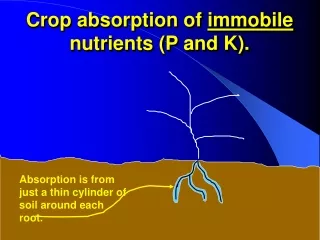
Absorption is from just a thin cylinder of soil around each root. Crop absorption of immobile nutrients (P and K). OSU Soil Fertility 04 01
A-y for x1 and Dy1 Dy2 Yield (y) Dy1 x1 x2 Increasing level of growth factor (nutrient, x) • Plant Growth and Soil Nutrient Supply Relationships • Mitscherlich (1909) • “…increase in yield of a crop as a result of increasing a single • growth factor is proportional to the decrement from the • maximum yield obtainable by increasing the particular growth • factor.” • dy/dx = (A - y) c • Law of • “diminishing • returns” OSU Soil Fertility 04 01
Bray mobile nutrient 100 % of Maximum Yield or “Yield Possibility” 75 50 10 40 70 100 Soil Phosphate (P) or Potassium (K) Supply (soil test index) • Plant Growth and Soil Nutrient Supply Relationships • Bray • “…as the mobility of a nutrient in the soil decreases, the amount of that • nutrient needed in the soil to produce a maximum yield (the soil nutrient • requirement) increases from a value determined by the magnitude of the yield • and the optimum percentage composition of the crop, to a constant value.” OSU Soil Fertility 04 01
Plant Growth and Soil Nutrient Supply Relationships • Mitscherlich • Soil deficiency levels could be expressed as a “percent • sufficiency” 100 % of Maximum Yield or “Yield Possibility” 75 50 10 40 70 100 Soil Phosphate (P) or Potassium (K) Supply (soil test index) OSU Soil Fertility 04 01
Plant Growth and Soil Nutrient Supply Relationships • Mitscherlich • Soil Test Correlation and Calibration • Soil Test Percent Fertilizer • P IndexSufficiency P2O5 • 0 25 80 • 10 45 60 • 20 80 40 • 40 90 20 • 65+ 100 0 OSU Soil Fertility 04 01
45 40 35 Yield (bu/acre) 30 25 20 0 10 20 30 40 50 P2O5 Rate (lb/acre) Wheat Response to Fertilizer-P at STP of 20 OSU Soil Fertility 04 01
General response of crops to fertilizer P Y = YG [ PSP +(2 FP/DP) (100 - PSP) - (FP/DP)2 (100 - PSP)]/100 • Where: • PSP = Percent sufficiency P determined from calibrated soil test. • FP = Rate of Fertilizer P2O5 applied. • DP = P2O5 deficiency determined from calibrated soil test Y = YG [ PSP +(2 FP/DP) (100 - PSP) - (FP/DP)2 (100 - PSP)]/100 Y = YG [ a + x b1 - x2 b2]/100 OSU Soil Fertility 04 01