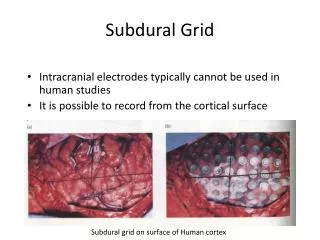
Subdural Grid
Subdural Grid. Intracranial electrodes typically cannot be used in human studies It is possible to record from the cortical surface. Subdural grid on surface of Human cortex. Electroencephalography and the Event-Related Potential.

Subdural Grid
E N D
Presentation Transcript
Subdural Grid • Intracranial electrodes typically cannot be used in human studies • It is possible to record from the cortical surface Subdural grid on surface of Human cortex
Electroencephalography and the Event-Related Potential • Could you measure these electric fields without inserting electrodes through the skull?
Electroencephalography and the Event-Related Potential • 1929 – first measurement of brain electrical activity from scalp electrodes (Berger, 1929)
Electroencephalography and the Event-Related Potential Voltage Time • Place an electrode on the scalp and another one somewhere else on the body • Amplify the signal to record the voltage difference across these electrodes • Keep a running measurement of how that voltage changes over time • This is the human EEG
Electroencephalography and the Event-Related Potential • 1929 – first measurement of brain electrical activity from scalp electrodes (Berger, 1929) • Initially believed to be artifactual and/or of no significance
Electroencephalography • pyramidal cells span layers of cortex and have parallel cell bodies • their combined extracellular field is small but measurable at the scalp!
Electroencephalography • The field generated by a patch of cortex can be modeled as a single equivalent dipolar current source with some orientation (assumed to be perpendicular to cortical surface) Duracell
Electroencephalography • Electrical potential is usually measured at many sites on the head surface
Magnetoencephalography • For any electric current, there is an associated magnetic field Electric Current Magnetic Field
Magnetoencephalography • For any electric current, there is an associated magnetic field • magnetic sensors called “SQuID”s can measure very small fields associated with current flowing through extracellular space Electric Current Magnetic Field SQuID Amplifier
Magnetoencephalography • MEG systems use many sensors to accomplish source analysis • MEG and EEG are complementary because they are sensitive to orthogonal current flows • MEG is very expensive
EEG/MEG • EEG/MEG changes with various states and in response to stimuli Electroencephalogram
EEG/MEG • Any complex waveform can be decomposed into component frequencies • E.g. • White light decomposes into the visible spectrum • Musical chords decompose into individual notes
EEG/MEG • EEG is characterized by various patterns of oscillations • These oscillations superpose in the raw data 4 Hz 4 Hz + 8 Hz + 15 Hz + 21 Hz = 8 Hz 15 Hz 21 Hz
How can we visualize these oscillations? • The amount of energy at any frequency is expressed as % power change relative to pre-stimulus baseline • Power can change over time 48 Hz % change From Pre-stimulus 24 Hz 16 Hz Frequency 8 Hz 4 Hz +200 +400 +600 0 (onset) Time
Where in the brain are these oscillations coming from? • We can select and collapse any time/frequency window and plot relative power across all sensors Win Lose
The Event-Related Potential (ERP) • Embedded in the EEG signal is the small electrical response due to specific events such as stimulus or task onsets, motor actions, etc.
The Event-Related Potential (ERP) • Embedded in the EEG signal is the small electrical response due to specific events such as stimulus or task onsets, motor actions, etc. • Averaging all such events together isolates this event-related potential
The Event-Related Potential (ERP) • We have an ERP waveform for every electrode
The Event-Related Potential (ERP) • We have an ERP waveform for every electrode
The Event-Related Potential (ERP) • We have an ERP waveform for every electrode • Sometimes that isn’t very useful
The Event-Related Potential (ERP) • We have an ERP waveform for every electrode • Sometimes that isn’t very useful • Sometimes we want to know the overall pattern of potentials across the head surface • isopotential map
The Event-Related Potential (ERP) • We have an ERP waveform for every electrode • Sometimes that isn’t very useful • Sometimes we want to know the overall pattern of potentials across the head surface • isopotential map Sometimes that isn’t very useful - we want to know the generator source in 3D
Brain Electrical Source Analysis • Given this pattern on the scalp, can you guess where the current generator was?
Brain Electrical Source Analysis • Given this pattern on the scalp, can you guess where the current generator was? • Source Imaging in EEG/MEG attempts to model the intracranial space and “back out” the configuration of electrical generators that gave rise to a particular pattern of EEG on the scalp Duracell
Brain Electrical Source Analysis • EEG data can be coregistered with high-resolution MRI image Source Imaging Result Structural MRI with EEG electrodes coregistered
Intracranial and “single” Unit • Single or multiple electrodes are inserted into the brain • “chronic” implant may be left in place for long periods
Intracranial and “single” Unit • Single electrodes may pick up action potentials from a single cell • An electrode may pick up thecombined activity from several nearby cells • spike-sorting attempts to isolate individual cells
Intracranial and “single” Unit • Simultaneous recording from many electrodes allows recording of multiple cells
Intracranial and “single” Unit • Output of unit recordings is often depicted as a “spike train” and measured in spikes/second • Spike rate is almost never zero, even without sensory input • in visual cortex this gives rise to “cortical grey” Stimulus on Spikes
Intracranial and “single” Unit • Local Field Potential reflects summed currents from many nearby cells Stimulus on Spikes
Relationship between EEG / LFP / spike trains • All three probably reflect related activities but probably don’t share a 1-to-1 mapping • For example: there could be some LFP or EEG signal that isn’t associated with a change in spike rates. • WHY? Whittingstall & Logothetis (2009)