Download
1 / 50
500 likes | 635 Vues
Gulf of Maine winter flounder Operational Update 2014. GARM III & SARC 52 Gulf of Maine Winter Flounder Conclusion. Wicked retrospective pattern and a very large change in Qs for the split VPA models Or a horrible fit to commercial age comps in ASAP.

E N D
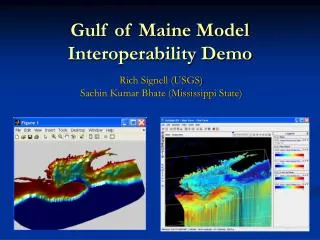
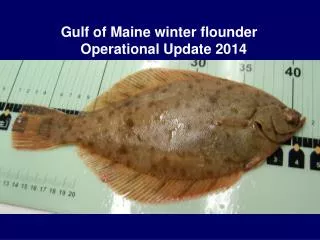
Gulf of Maine winter flounder Operational Update 2014
GARM III &SARC 52 Gulf of Maine Winter Flounder Conclusion Wicked retrospective pattern and a very large change in Qs for the split VPA models Or a horrible fit to commercial age comps in ASAP. Models have difficulty with the apparent lack of a relationship between a large decrease in the catch with little change in the indices and age and/or size structure over time. GARM III SARC 52 Models were rejected
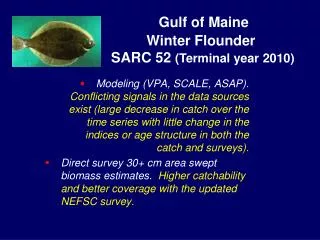
Gulf of Maine Winter Flounder SARC 52 (Terminal year 2010) • Modeling (VPA, SCALE, ASAP).Conflicting signals in the data sources exist (large decrease in catch over the time series with little change in the indices or age structure in both the catch and surveys). • Plan B (Appendix C1 in SARC 52) • “A new sophisticated model” • Direct survey 30+ cm area swept biomass estimates.
Gulf of Maine Winter Flounder SARC 52 Status • Plan B Appendix C1 in SARC 52 • Exploitation rates based of catch/30+ cm area swept biomass were low. • Overfishing was not occurring (F2010/F40% = 0.13). • The Overfished status is unknown.
Updated discards 2004-2013 (Discard/Keptall ratio x Keptall)
Commercial Discards assume a 50% mortality Recreational Discards assume 15% mortality
MDMF and NEFSC (RV Bigelow) and MENH surveys catch significant numbers of GOM winter flounder per tow. • Bigelow sampling intensity increased for inshore strata. • MENH surveys now covers a large area of the stock since 2000. • Overfishing status was robust to a range of survey efficiency assumptions (Q).
Exploitable Biomass = 30cm+ biomass index per tow /1000 x total survey Area/tow footprint x 1/q Q = 0.6 Informed by GB winter flounder Exploitation rate = catch / 30cm+ biomass.
Combined Surveys 30+ Biomass Estimate
Length based YPR from SARC 52 m=0.3 FMSY = F40% = 0.31 Exploitation rate = 0.23 75%FMSY = 0.24 Exploitation rate = 0.17 Knife edge selectivity at 30 cm
Table B8 Wing Spread Door Spread
Fall 2010 based on different strata
Table B9 wing spread
Table B10 door spread and q = 0.37 Fall 2013 Q = 1.0 using wing spread Biomass = 1,759 mt Q = 0.37 using door spread Biomass = 1,852 mt
Uncertainty was estimated using the Latin Hypercube approach 40 equal probability intervals 406 = 4,096,000,000 evaluations
OFL = 1458 SARC 52 Fall 2010
OFL OP-UP Fall 2013
ABC = 1078 SARC 52 Fall 2010
ABC OP-UP Fall 2013
2014 Empirical Benchmark of Georges Bank yellowtail Little information exists to inform the Q assumption. There are questions with herding from the ground cable and footrope escapement in the surveys. The GB yellowtail benchmark used a Q estimated from the flatfish literature (0.37 on the doors). However catch advice from door spread estimates would still have resulted in higher catch limits than the removals that have occurred.
Concerns Catch and exploitation rates have been very low (in the 300 mt range over the last few years, ABCs set at 1,078 mt). There has been no signs of increases in the survey 30+ biomass. There are some signs of recent declining biomass in the surveys.