Download
1 / 16
160 likes | 251 Vues
Using Postsecondary Graduation rates to Improve Outcomes for Low Income Students. April 24, 20013. Nationally, only 11% of low income students graduate college.

E N D
Using Postsecondary Graduation rates to Improve Outcomes for Low Income Students April 24, 20013
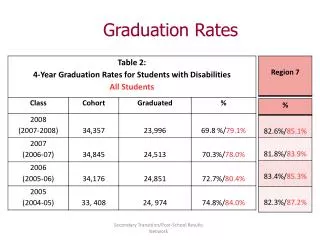
Nationally, only 11% of low income students graduate college College graduation rate for CPS 9th graders estimated to be 10% for both African American and Hispanic students (27% and 23%, respectively, of 9th graders enroll in college) Source: Mortenson, Tom. “Bachelor’s Degree Attainment by Age 24 by Family Income Quartiles, 1970 to 2010.” http://www.postsecondary.org. Underlying data sources: Current Population Survey, U.S. data for 2010 compiled with assistance of Kurt Bauman, Chief, Education and Social Stratification Branch, U.S. Census Bureau. ; Roderick, Melissa, et al. “From High School to the Future: A First Look at Chicago Public School Graduate’s College Enrollment, College Graduation, and Graduation from Four-Year Colleges.” 2006
Our results are 3x those for low income students, but lower than our aspirations 6+ years: 37% graduated (33% 4-year degrees, 4% 2-year degrees) , 9% persisting Number of alumni 80 81 98 91 73 107
Classes of 2009-2011 show persistence trends similar to prior years Number of alumni 310 102 502 Source: National Student Clearinghouse reports and Alumni Coordinator verification
Noble alumni have had 6 year bachelor’s attainment similar to the averages for the institutions they first attended Most Competitive (N=16) Very Competitive (N=44) Highly Competitive (N=26) Competitive (N=93) Less/Non Competitive (N=9) 2 year (N=47) *Analysis calculated only for those alumni matriculating directly to college in fall after high school from Classes of 2003-2006; graduations from any college count towards total shown here (this is a comparison of bachelors—including associate’s increases Noble’s total by 4%); Institution used is the first school a student matriculated to, even if multiple schools were eventually attended; 2 year colleges have half their transfer rate added to the value
Five interrelated factors have been shown to influence college persistence Academic readiness A powerful set of character strengths zest grit self-control optimism gratitude social intelligence (including self-advocacy) • The right match:student + school Social and academic integration College affordability and financial understanding
Noble’s College Team—campus driven with campus choice for structure and program • College Counseling: • 2-5 people working with 100-170 seniors • Some campuses working with juniors • Some campuses working with (some) freshmen • Some influence on advisory curriculum • Alumni Coordination: • 1 (mostly) full time person, if have alumni Right Angle Exec Dir: Works with campus coordinators to send ~25% of sophomores to summer programs (10-50% by campus) 9 campuses with seniors • Chief College Officer: • Support all college work • Provide strategic direction • Develop tools (1 with juniors, 2 with only freshmen)
College Success pipeline—definitions are first step to data clarity & transparency • College Counseling • Alumni Coordination 12th grade profile Gradua-tion • ACT • GPA/Rank • Intangibles • % Bachelor’s • % Associate’s • % Trade/job? Schools Applied to Cohort persist-ence • # of applications • Over/undermatch • Application quality • % retention • % transfer • % re-enroll Schools accepted to 1st year persist-ence • #/% accepted • Over/ undermatch • Packages • % retention • % transfer • % leave/ enroll School choice (spring) School matricul-ation (fall) • 6 yr grad rates • 1styr retention • % matriculating • % change schools
Class of 2012 proj. grad rate pipeline • Estimated potential of ~65% (if all students match), ~72% (if all reach) 12th grade profile • Highest admitted: 56% (~half match/half safety, no regard for cost or preference) • Second highest for each student:49% (average student at a safety, no regard for cost or student/family preference) Schools Applied to • 42%, average student a bit below safety Schools accepted to • 39%, 10% of students not in college School choice (spring) School matricul-ation (fall)
New tools/data for College Counseling • College Counseling • Introduced in August • Student matching exploration tool (“Robot”) • Introduced in November • Application “portfolio” tracking • Coming this month • Financial aid evaluator 12th grade profile • ACT • GPA/Rank • Intangibles Schools Applied to • # of applications • Over/undermatch • Application quality Schools accepted to • #/% accepted • Over/ undermatch • Packages School choice (spring) • 6 yr grad rates • 1styr retention
New tools/data for Alumni Coordination • Alumni Coordination • Introduced in August • New Salesforce Alumni Tracking & Support Database • Mentoring pilot (ACI) • Introduced in December • New streamlined check of National Student Clearinghouse data Gradua-tion • % Bachelor’s • % Associate’s • % Trade/job? Cohort persist-ence • % retention • % transfer • % re-enroll 1st year persist-ence • % retention • % transfer • % leave/ enroll School matricul-ation (fall) • % matriculating • % change schools
What’s next? • Continued analytic focus on college match and financial aid • Bring “Hedgehog” to college (standards and assessments for college completion) • Deepening college partnerships • City Colleges (cohort, collaboration, path plan) • ACI (mentoring ~150 with ~25 upper class alumni) • University of Illinois (all campuses) • Opportunistic (DePaul, IIT, Oberlin, Wooster) • Driving better career focus in students/alums