Download
1 / 67
680 likes | 1.32k Vues
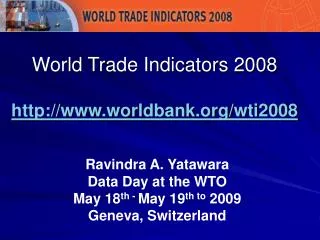
World Trade Indicators 2008 http://www.worldbank.org/wti2008. Ravindra A. Yatawara May 18 th - May 19 th to 2009 Geneva, Switzerland. Structure of WTI database: organizing for users. TRADE FACILITATION What gets measured, get managed Logistics Performance Index (LPI)

E N D
World Trade Indicators 2008http://www.worldbank.org/wti2008 Ravindra A. Yatawara May 18th - May 19th to 2009 Geneva, Switzerland
TRADE FACILITATION What gets measured, get managed Logistics Performance Index (LPI) Trading Across Borders- DB Others Indicators- e.g. Liner Shipping Connectivity Index
Thick borders imply high trade costs that: • constrain access to regional and global markets, and • lower competitiveness of firms and their scope to exploit scale and diversify • In Context of Global Economic Crisis • Trade Facilitation Reform seen as key to penetrating shrinking export markets
www.worldbank.org/lpi Ranking and component • Logistics business environment and institutions • Performance data Available asrankings, maps, scorecards Contact: tradefacilitation@worldbank.org
Partnership with the private sector • Built on 5,500 country assessments by more than 800 logistics professionals worldwide: • Assessments from professionals outside the country, trading with it • Assessment of domestic business environment and institutions and time and cost data • Questionnaire designed with input from trade and logistics professionals • Primary data gathered for 150 countries
The survey uses an anonymous, web-based questionnaire asking respondents to evaluate their country of residence and eight countries they are dealing with on several logistics dimensions
International LPI – 150 countries • - Score (1-5,best) • - Qualitative • - Based on respondents evaluating 8 countries they deal with
The (International) LPI measures SEVEN dimensions of country performance • Efficiency of the clearance process • Quality of transport and IT infrastructure • Ease of arranging competitively priced shipments • Logistics competence and quality of logistics services • Tracking and tracing • Domestic logistics costs • Timeliness
DOMESTIC LPI - 100 countries 1) Performance – Quantitative 2) Environment & Institutions- Qualitative
PERFORMANCE DATA FOR INDONESIA • Rate of physical inspection (%) _0.12 • Customs clearance (days) 1.58 • Lead time export, median case (days) 2.54 • Lead time import, best case (days) 1.91 • Lead time import, median case (days) 3.88 • Number of border agencies exports 2.73 • Number of border agencies imports 2.73 • Possibility of a review procedure (%) 0.38 • Typical charge for a 40-foot export container or a semi-trailer (US$) 266.00 • Typical charge for a 40-foot import container or a semi-trailer (US$) 244.44
ENVIRONMENT & INSTITUTIONS • 5 choices from very high to very low • Reported as share that chose Very high/high • 1) logistic operational environment • 2) quality of infrastructure • 3) efficiency and effectiveness of processes • 4) level of competence of professions • 5) 3 Year evolution of business env, customs • 6) Incidence of informal payments, crime
LPI Rankingpresents performance scores of all countries on the LPI index, as well as on the seven key dimensions, in a sortable format
Key messages Trade logistics performance is only as good as the weakest link Predictability and reliability are as important as cost and speed The LPI can assess your country’s bottlenecks and opportunities for reform – and where, if necessary, to direct “aid for trade” The LPI can mobilize broad constituencies for reform
Key Policy Implications POLICY IMPLICATIONS • Expand the traditional reform agenda beyond customs reform and infrastructure development • Improve the quality of logistics services and increase border agency coordination • Embark on comprehensive reform—processes, services, and infrastructure—with broad public and private support • LPI as an preliminary indicator – • Pursue Trade and Transport Facilitation Audits (TTFA) Develop National Logistics Strategies
LPI 2009 - LAUNCHED May 12, 2009 • Improvement in survey design • More explicit description of time to export/import • New module on customs • Domestic Logistics costs replaced with Implementation of Cargo Security Requirements • Results out end June /early July 2009
Trade Facilitation Indicator: DOING BUSINESS (DB) DB 2010 : Out Sept 2009
Doing Business: Quantitative measure of regulations for • Starting a business • Dealing with construction permits • Employing workers • Registering property • Getting credit • Protecting investors • Paying taxes • Trading across borders • Enforcing contracts • Closing a business Source: World Bank Doing Business
Top 30 on the Ease of Doing Business - 2009 Source: World Bank Doing Business
Top Reformers in 2007/2008 Source: World Bank Doing Business
Top reformers by indicator Source: World Bank Doing Business
Highlights of Doing Business 2009 • 239 reforms in 113 countries. Highest recorded in 6 years of Doing Business • Eastern Europe and Central Asia – 62 reforms in 23 of the 25 countries, 25% of the total recorded worldwide. Fastest reforming region. • 4 of top 10 reformers from Eastern Europe and Central Asia • Africa – 28 of 46 countries completing 58 reforms, highest rate of reform recorded in the region. • 3 of top 10 reformers from Africa • 1000 reforms recorded over past 6 reports, 174 informed by Doing Business Source: World Bank Doing Business
Most popular reforms in 2007/2008 Source: World Bank Doing Business
Doing Business Subcategory TRADING ACROSS BORDERS
Doing Business -Trading Across Borders (rank 1 – 181, worst) • Based on: • 1) Number of documents for import/export • 2) Time(in days) for import/export • 3) Cost(US $ per container) to import/export A higher rank is associated with a more favorable environment for trading across borders. Source: World Bank Doing Business
Documents required to export and import • Bank documents • Customs clearance documents • Port and terminal handling documents • Transport documents • Time required to export and import • Obtaining all the documents • Inland transport • Customs clearance and inspections • Port and terminal handling • Does not include ocean transport time • Cost required to export and import (US $ per container) • Obtaining all the documents • Inland transport • Customs clearance and inspections • Port and terminal handling • Official costs only, no bribes or tariffs Source: World Bank Doing Business
DB – Trading Across Borders: Top 10 countries (rank) Source: WTI 2008
DB – Trading Across Borders: Bottom 10 countries (rank) Source: WTI 2008
DB – Trading Across Borders: Top 10 Improvements Source: WTI 2008
DB – Trading Across Borders: Top 10 Slippages Source: WTI 2008
Speeding trade – improving reforms across regions Source: World Bank Doing Business
Complementarities LPI/DB • Comparisons and overlaps • Limited correlation (at least with stringent tests: rank, partial) of main indicators (LPI and DB time X/M) • Different concepts of time to import and export, with huge discrepancies
Scatter plot of LPI AND DB (rank)- 2006 Source: WTI 2008
Other Trade Facilitation Indicators: UNCTAD Liner Shipping Connectivity Index (0-100, best) Computed average index which combines the available information about a country’s maritime transport. For comparison purpose, maximum value of the LSCI is set to 100. Calculated as the un-weighted average of five components: ships, TEUs, companies, services, and maximum vessel size. Each one of the five components is indexed to assume a maximum value of 100 in 2004. Average of the five indexed components is again indexed so that its maximum value for 2004 is 100. Source: UNCTAD Transport Newsletter
UNCTAD Liner Connectivity IndexTop 10 countries (highest indexes) Source: WTI 2008
Total Freight Cost to US (% of import value) Ratio of total freight charges and insurance costs to the net value of merchandise goods imports. Calculated at the origin of US ports and is reported as a percentage of import value. Includes all shipment through air, maritime and land freights but excludes domestic transportation costs between cities. Source: US International Trade Commission
Total Freight Costs to US ($ of import value) Top 10 countries - Lowest Frequent Charges Source: WTI 2008
Total Freight Costs to US ($ of import value) Bottom 10 countries – Highest Frequent Charges Source: WTI 2008
Air Freight Cost to US (% of import value) Ratio of total air freight charges and insurance costs to the net value of merchandise goods imports. Calculated at the origin of US gateways, and is reported as a percentage of import value. Average Air Freight Rate reflects the costs of transport from the US main ports to the foreign coutnries at the US customs procedure. Source: US Department of Commerce, US Census Bureau. Us Imports of Merchandise
Air Freight Costs to US ($ of import value) Top 10 countries - Lowest Frequent Charges Source: WTI 2008
Air Freight Costs to US ($ of import value) Bottom 10 countries - Highest Frequent Charges Source: WTI 2008
Air Freight Cost from US (US$) Reflects the DHL international United States outbound worldwide priority express rate for a 1 pound rate packages in current US dollars. Additional service charges, shipment value protection, and other surcharges are excluded. Source:DHL Published Tariff Guide on Domestic and Internaitonal Shipping Services
Air Freight Costs from US (US $)Top countries – Lowest costs Source: WTI 2008