Download
1 / 26
260 likes | 279 Vues
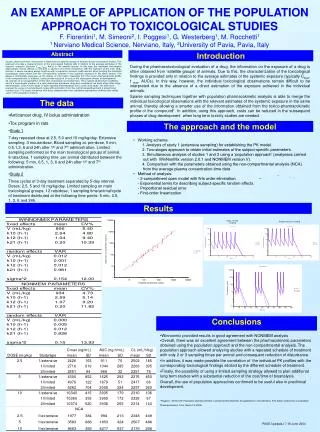
An Assessment of the Statistical Methods Typically Used to Analyse Toxicological Studies. Helena Geys Janssen Pharmaceutica (J&J), Belgium & Philip Jarvis AstraZeneca, UK. Cross-pharma Collaborative Effort. Philip Jarvis (AstraZeneca, R&D, UK) Jim Saul (Covance Laboratories, UK)

E N D
An Assessment of the Statistical Methods Typically Used to Analyse Toxicological Studies Helena Geys Janssen Pharmaceutica (J&J), Belgium & Philip Jarvis AstraZeneca, UK
Cross-pharma Collaborative Effort • Philip Jarvis (AstraZeneca, R&D, UK) • Jim Saul (Covance Laboratories, UK) • Mike Aylott (Glaxosmithkline, UK) • Simon Bate (Huntingdon Life Sciences, UK) • Helena Geys (Janssen Pharmaceutica & Hasselt University, Belgium) • John Sherington (Pfizer, UK)
Toxicology – “Helicopter View” • Identify and/or Qualify unwanted effects of compounds • Hazard Identification e.g. Does compound cross the placenta (y/n) • Risk Assessment e.g. Effects linked to Extent of compound exposure (dose, regimen, duration of dosing). Is there a safe dosing regimen. • Cannot in most cases quantify what “not safe” is a priori • For majority of end-points, can classify “normal” • Positive Toxicity Finding • Reproducible unwanted effect observed across majority of animals in a compound dosed group • Large effect in a single animal e.g. Cardiac lesion
Goal of this paper • To consolidate, present and assess the range of statistical methods used cross-companies for: • In-vivo micronucleus assays • Comet assays • Organ Weight Analyses • Cardiovascular Telemetry Studies • Central Nervous System • Carcinogenicity Studies • To present analysis recommendations and critical discussions • Note: for this paper, in the interest of time attention will be focused most on genotoxicity studies.
Genotoxicity Testing • General purpose: • Detect compounds which induce genetic damage directly or indirectly by various mechanisms • Positive compounds may induce • Cancer and/or • Heritable defects • A standard genotox battery includes two invitro and one invivo assay: • Test for gene mutations in bacteria (AMES) • Invitro test to detect chromosome aberrations • Invivo micronucleus test (e.g Invivo MNT) • In the event of a positive event a COMET assay is often considered
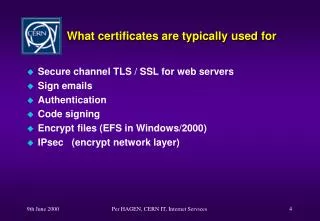
bone marrow blood X Aneugenic chemicals Orthochromatic Erythroblast Polychromatic Erythrocyte Normochromatic Erythrocyte Reticulocyte PCE NCE RET NCE Single chromosome, 2N 2C G1 DNA Synthesis Chromosome replication S Mitosis G2 Interphase X Clastogenic chemicals Doubled chromosome, 2N 4C Invivo Micronucleus Test(slide: Bas-Jan Van der Leede)
Invivo Micronucleus Test: Design(slide: Bas-Jan Van der Leede) Single dose/Multiple sampling 0h 24h 48h Species: mouse/rat/…. Gender: 6 or 7 males in single gender 5 males/5 females Samples: bone marrow/peripheral blood Dose groups: VC, L, I, H, PC
Invivo Micronucleus Test: Current Statistical Analyses among PSI • Analysis of V, L, I, H dose groups: wide variety of approaches cross-company! • General Linear Model on transformed data (e.g square root or log) • Exact trend test (e.g one-sided JT) • Pairwise test: compare each dosegroup versus V • Generalized linear model (Poisson model with adjustment for multiple comparisons) • …. • Same final conclusions reached for two study test datasets analysed by 4 different companies • Concurs with the outcomes of a similar exercise described by Lovell et al. (1989) on a subset of methods
Invivo Micronucleus Test: Current Statistical Analyses among PSI PC only used as check of study/equipment validity (separate VC-PC comparison) Historical Control Data: • Not formally used in stats analysis • Used to place statistical analysis into context
Invivo Micronucleus Test: critical appraisal / future music? Hothorn and Gerhard (2009): • What is the endpoint distribution? • Binomial proportion or count (Poisson data) • What is the experimental unit? • Clearly, the animal. Hence, variability between animals should be taken into account, e.g using a quasi-Poisson model or quasi-binomial model. • Confidence intervals or pvalues? • Pvalue is just a number between 0 and 1 • Conf intervals allow the claim for both significance and biological relevance by its distance to the null-hypothesis value of one. • PSI Tox Sig • In presence of toxicity does the assumption that each group’s responses arise from the same distribution hold? Probably not but it does not matter as result would be deemed a clear “positive”
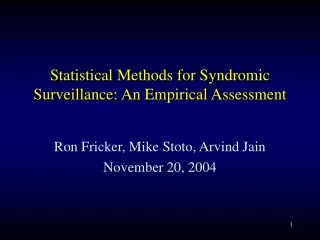
COMET Assay (Bright et al. 2011, Pharmaceutical Statistics) • Cells • From liver, stomach, kidney, duodenum, (blood) • Embedded in a thick layer of gell • Put in electrophoresis tank • Broken strands of DNA migrate out of the nucleus in a “comet tail” (source: http://www.cellbiolabs.com/comet-assay-kits-and-slides)
Comet Assay • Advantages: • Quick • Sensitive • Cheap • Useful evaluation of local genotoxicity in organs which cannot easily be evaluated with other standard tests • Optimal Experimental Design (Smith et al. 2008, Recommendations for the design of the Comet Assay, Mutagenesis, 1-8) • V, L, I, H (+PC) dose groups • 2-3 gells per tissue • 50 nuclei per gel • 5-6 rats per dose group
Comet Assay: Nested Design • Three-level hierarchies with clustering at animal and slide level
Comet Assay: Responses of Interest • Tail Length (TL) • Length of tail • Criteria for determining the end of the tail • Not comparable across studies • Tail Intensity • Intensity of DNA fragments in the tail • Can be standardized across studies • Primary endpoint • Tail Moment (TLxTI)
Comet Assay: Statistical Issues/Challenges • Non-Gaussion Outcomes (time-to-event like) • Asymmetric • Skewed • Positive • Bi- or multimodal • Mixture • … • Multi-level hierarchical structure
Comet Assay: Current recommended Approach for day-to-day analyses (Bright et al. 2011, Pharmaceutical Statistics) • Analyse each tissue separately • Omit PC because variability is typically smaller here • Analysis strategy for V, L, I, H: • Log transform the outcome (+0.0001) • Picture the raw TI for individual cells: impression of distribution of values and how these may have changed wrt location and/or variability) • Hierarchical structure is partly or completely ignored • Summarize per gel or per animal through median and mean • Central limit theorem: approximately normal • Analyse using ANOVA or repeated ANOVA
Comet Assay: Current recommended Approach for day-to-day analyses (Bright et al. 2011, Pharmaceutical Statistics) • Recommend that confidence intervals and p-values should be 1-sided (assuming, as is usual, that it is only increases in TI that are of biological importance). • Typically p-values are not adjusted for multiple comparisons but there is not a consensus and it remains a point of discussion. • Again one might argue that focus should be on the confidence intervals rather than p-values, since the former immediately convey the sizes of effects consistent with the study data (for a given level of “confidence”).
Comet Assay: Alternative Analysis Approaches • Ghebretinsae et al. (2012 JBS) recently published a paper on a Bayesian Generalized Frailty Model for Comet assays that: (1) uses the Weibull distribution (2) deals with the complete hierarchical nature; (3) uses all information instead of summary measures. • For TI (primary endpoint!) • results in line with the simpler recommended traditional approach! (slightly higher SE) • For TL (secondary endpoint): • Accounting for the hierarchical structure and inclusion of an overdispersion parameter had a substantial impact on the estimate (approx 3 times) and standard error (4 times) • Underscores the risk of using models that are too simple
General TOX Example: Organ Weight Analysis GENERAL • Key biomarker for assessing whether a compound can cause organ damage • The direction of damage depends on the type of organ and type of therapy • The appropriate statistical analysis for organ weight data has been the subject of debate for many years: • Absolute organ weights • Relative organ weights • ANCOVA with terminal body weight as covariate • PSI SIG TOX • Investigated OW from 66 studies (rats 60%, mice 27%, nonrodents 13%) • Recommendation was to perform ANCOVA • Yielded a more sensitive test when there is a relationship between treatment and organ weight • Guarded agains falsely claiming organ weight differences when there was an effect on terminal BW • Coincides with findings of Shirley (1977)
CNS Studies: IRWIN Battery Design: V, L, I, H Six rodents/group Single dose study with predose and 24h assessments Incidence Data: • manual recordings of animal behavior • Not analysed statistically • Observations ‘noteworthy’ if at least 3 rats within each treatment group show signs over and above the incidence in the vehicle group Quantitative Data: • E.g grip strength, temperature,.. • Predose incorporated in analysis via • Response (mean %effect relative to baseline) • ANCOVA (or nonparametric alternative) followed by post-hoc comparisons using Dunnett or William’s
General Discussion Points Interpretation of Responses • Currently, proof of hazard is mostly implemented but “absence of proof is no proof of absence” • Proof of safety through formal equivalence tests is seldom adopted within the toxicology area!? • Informally it is assessed through historical control data, e.g. if the combined sample distribution of the three treated groups falls within the historical control sampling distribution • Historical control mean and dispersion should be stationary (use process control charts!)
General Discussion Points Data not being missing at random • Setting the high dose is not easy: • Should be tolerated • Should induce toxicological effects • Data from animals that cannot tolerate the test system are missing • How to account for this in a statistical analysis? • One approach would be to treat it bivariate and/or hierarchically, i.e. (cfr. Reprotox studies) • Model the number of animals that tolerate the system • Given the animal tolerates the system, model the toxicological effects
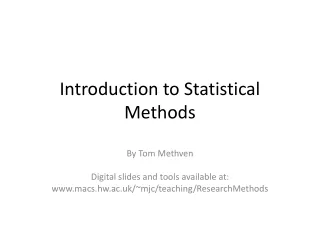
E.g. Male Fertility Analysis Flow Chart (Treated versus Vehicle group comparison) Pregnancy outcome (e.g. number of live embryos) similar in both groups? Pregnancy outcome (e.g. number of live embryos) similar in both groups? n Majority of males in treated group mate successfully? (<2 fail to mate) y y n Compound affects ability of males to mate but does not affect pregnancy outcome Compound affects ability of males to mate and pregnancy outcome y n Compound does not affect male fertility No affect on ability of males to mate but compound does affect pregnancy outcome Figure 6
General Discussion Points Adjustment for Multiplicity? • Recommended approach is NOT to use any multiplicity adjustment within safety assessment • More appropriate to find a false positive at the expense of a false negative