Enhancing Efficiency: Key OM Tools and Techniques for Reducing Processing and Waiting Times
90 likes | 197 Vues
In an era of global competition, optimizing operations management is crucial for success. This document explores various tools and techniques to minimize processing and waiting times within supply chains. It emphasizes the importance of viewing workers as assets, implementing Total Quality Management, and embracing Lean Manufacturing principles. By addressing inventory as waste and understanding the costs associated with variability, organizations can improve flow time and customer satisfaction. Key models like ABC analysis and value stream mapping are essential for identifying priorities and reducing inefficiencies.

Enhancing Efficiency: Key OM Tools and Techniques for Reducing Processing and Waiting Times
E N D
Presentation Transcript
Recent Trends • Global Competition • Global Market • Global Suppliers • Supply Chain Management • Not from RM storage to FG warehouse, but from the original suppliers to final consumers • Under separate ownerships • Workers Involvement • Workers are not costs, they are assets • Total Quality Management • Lean Manufacturing • Inventory is waste • Variability is evil
Lean Operations: The Real Cost of Inventory Inventory adversely affects all competing edges (P/Q/V/T) • Has cost • Physical carrying costs • Financial costs • Has risk of obsolescence • Due to market changes • Due to technology changes • Leads to poor quality • Feed back loop is long • Hides problems • Unreliable suppliers, machine breakdowns, long changeover times, too much scrap. • Causes long flow time Product Product Wait Customer
Centralization; inventory and Capacity Centralization of stocks reduces inventory. • Centralization of Servers reduces waiting line. • Why doesn’t everybody do it? • Longer response time • Higher shipping cost • Less understanding of customer needs • Less understanding of cultural, linguistics, and regulatory barriers These disadvantages my reduce the demand.
Pareto phenomenon (ABC analysis) Classifying items, activities, or tasks according to some measure of importance and allocating efforts and resources accordingly • A vital few things are important for reaching an objective or solving a problem. • 80/20 rule – 80% of the problems are caused by 20% of the activities. Recognition of Priorities.
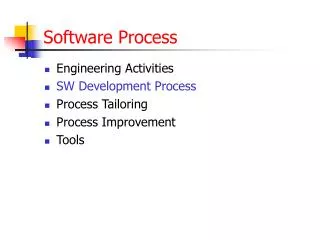
Models -Representations A model is an abstraction of reality • Narrative • Tabular • Schematic (Some times Physical) • Mathematical • Linear programming • Transportation model • Inventory models • Waiting line models • Statistical models Count what is countable. Measure what is measurable. What is not measurable, make it measurable. Galileo Galilei, 1564 -1642.
Schematic Representation of the Process (Flow Charts) • Points where processing times are large. • Activities that contains material or capacity constraints. • Points where there is a high degree of resource sharing. When the same resource is required to process a variety of products. • Divergence points where common materials are transformed into different product streams. • Convergence points where multiple materials must come together. • Points of excessive variation. Mc Donald's make-to-stock system (Prior to 1999). Raw Material Finished Goods Customer places order Cook Assemble Deliver
Value Stream Mapping • Points where processing times are large. • Activities that contains material or capacity constraints. • Points where there is a high degree of resource sharing. When the same resource is required to process a variety of products. • Divergence points where common materials are transformed into different product streams. • Convergence points where multiple materials must come together. • Points of excessive variation.


![Seven Quality Tools [Statistical Process Control]](https://cdn3.slideserve.com/6416179/seven-quality-tools-statistical-process-control-dt.jpg)