Correlation signal OASys to Zero field
190 likes | 328 Vues
This documentation outlines a detailed investigation into the correlation between OASys signal and Zero field movement, focusing on data collected from the South Arm and North Arm of the experimental setup. Specifically, the study examines how the half-octants in both systems behave over two months, addressing dead areas and sagitta distribution. The analysis aims to explore the significance of motion alterations and efficiency variations across half-octants while ensuring the integrity of track measurements. The findings will contribute to understanding the mechanics of the system in zero field conditions.

Correlation signal OASys to Zero field
E N D
Presentation Transcript
Murata .Lab 2012 Last Group Meeting Correlation signalOASys to Zero field Rikkyo UniversityMurata.lab/ RIKEN Master course 2nd KentaroWatanbe
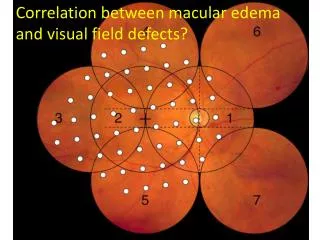
motivation : What is OASys signal ?? ④ ⑤ ③ half octant half octant ⑥ ② I investigatethe correlation half octant movement to the most inner OASys camera on each half octant. ① ⑦
South Arm track map March Zero field Run9 South Arm Conditions ・octant 7 half octant 1 is dead area. track efficiency movment octant 7 half 1 South Arm track map May Zero field octant 7 half 1
Normalized Sagitta distribution March Zerof & May Zerof Black: March data , Red May data Southarm sagitta distribution is normalized -2cm to 2cm
South Arm : the movement of Zero field mean & OASys dead octant Octant 4-2 dead octant Octant 7-1 ↑ it seems to be healthy tracks South Arm に関してはdeadoctant (oct 7-1) を除くと、その変位は80日間でOASys、Zero field共に±200μmである。 この中に相関があるかどうかを評価したい。
South Arm : the movement of Zero field mean & OASys ④ Almost half octant ID is 1 ⑤ ③ half octant half octant Almost half octant ID is 2 ⑥ ② しかし、大事な点はOASysとZero fieldの間に相関があるかどうか? ① ⑦
North Arm : the movement of Zero field mean & OASys こりゃ非道!!! Zero field 合ってる?? これが本当だと大変な事だ もっかい解析して
North Arm : the movement of Zero field mean & OASys March st1 march : oct 2-2 dead st1 march : recovered May st3 march : oct 5-1 dead
統計量の変動 the efficiency par half octant is different in the term ??
Normalized Sagitta distribution March Zerof & May Zerof Black: March data , Red May data North arm sagitta distribution is normalized -2cm to 2cm
800μmとかズレちゃう連中。0 拡大して見て更にわかる様に中心値はズレています。fittigによるズレでわなく。生データの段階でズレてます。よって、このmeanのズレはBGの揺らぎから来ているのか?tarckのイベントセレクションを行う事で、変化するのであろうか??んー疑わしいが、イベントセレクションしてみます。