THE NEW JCR
1.09k likes | 1.39k Vues
Journal Citation Reports on INCITES. SCIENTIFIC AND SCHOLARLY RESEARCH. THE NEW JCR. MASSIMILIANO CARLONI Strategic Business Manager massimiliano.carloni@thomsonreuters.com May 2014. AGENDA. The Thomson Reuters product portfolio (overview) The Next Generation of Incites

THE NEW JCR
E N D
Presentation Transcript
Journal Citation Reports on INCITES SCIENTIFIC AND SCHOLARLY RESEARCH THE NEW JCR • MASSIMILIANO CARLONI Strategic Business Manager • massimiliano.carloni@thomsonreuters.com • May 2014
AGENDA • The Thomson Reuters product portfolio (overview) • The Next Generation of Incites • JCR Improvements • WoS Integration • Categories by Rank • Journals by Rank • Compare Journals • Essential Science Indicators (hints) • The selection of journals (hints)
THOMSON REUTERS – BUSINESS AREAS Financial & Risk Legal Tax & Accounting IP & Science Design & Manage: Financial and Risk Large Law Firms Corporate Intellectual Property Small Law Firms Professional Scientific & Scholarly Research Build & Operate: Unified Platform Group Content & Analytic Services General Counsels Knowledge Solutions Life Sciences Government Government Go to Market: Regions Strategic Customer Solutions GTM Strategy & Operations Global Growth & Operations Reuters
THOMSON REUTERS SSR – Product Portfolio Next GenerationInCites Next GenerationWeb of Science EndNote ResearcherID
Essential Science Indicators THE NEXT GENERATION OF INCITES Research Profiles Institutional Profiles Content Global Comparisons Web Based Research In View Tools Journal Citation Reports Services INCITES A single destination for all research assessment & evaluation needs Cloud & API Semi-Custom Analytics Syndicated Analytics Custom Analytics Mobile Access Custom Data Sets
JOURNAL CITATION REPORTS • Improvements based on customer feedback • Bringing all analytics into one single environment (Next Gen Incites with improved visual design ). • Modern look and feel, consistent with Web of Science redesign (“family” SSR navigation and global header/footer and other elements: sign in, help, etc.. ). Brand awareness. • Integration with WoS Core Collections both behind the scenes and through the user interface (documents hyperlinked at the article level and journal overlay). • Integration with ESI: broadest categories/research areas (es. Chemistry) • Easy to analyze across editions and years (historical data). JCR Science Edition: Contains data from over 8,000 journals in 171 subject categories. JCR Social Sciences Edition: Over 3,000 journals in the 55 subject categories.
JOURNAL CITATION REPORTS • Improvements based on customer feedback • All JCR years are presented together for trend analysis. • Personalization: ability to save marked list and export (signed-in users) • Easy export: reports and full datasets (with license). • New filter panel allowing seamless transition between categories, journals, years, and JCR editions • Expanded visualization: graphs and journal comparisons (directly in the product). • New metric: Journal-level ego network diagrams (citing and cited data) based on Journal Impact Factor and Market Share relationships. Or IF without self citations
JOURNAL CITATION REPORTSNEW DESIGN: GLOBAL HEADER On login, users will be taken to the JCR home page, which grants immediate user access to data; the default view is of the overall category rankings. There are four main components of the JCR home page: the overall header, the visualization, the data grid, and the filters. The top of the page contains the global header to access all products in the subscriber's suite. JCR utilizes breadcrumbs in the navigation. In addition, there are icons for downloading data on a page, saving journals or filtered lists to the Custom Reports area, and downloading the JCR data files for local analysis purposes (only subscribers to the JCR add-on can access this feature).
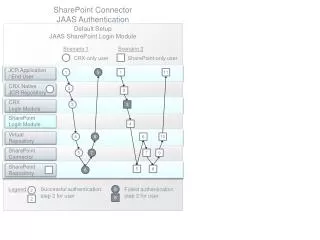
JOURNAL CITATION REPORTSWOS Integration - JCR IC2 Subscribers Access Journal Citation Reports from anywhere View summary journal information within the Web of Science interface
JOURNAL CITATION REPORTSWOS Integration - Not JCR IC2 Subscribers
JOURNAL CITATION REPORTSCATEGORIES BY RANK – link and node visualization Categories by Rank is the default view. View and interact with the Node & Link Network for an instant overview. Node size: # of journals in category / Impact Factor of journalLink width: Citation intensity between categories / journals
JOURNAL CITATION REPORTSCATEGORIES BY RANK – data grid The data grid will always be the area that displays user's choices. The default view is the categories, ranked by number of journals (to correspond to the default visualization). This list can be sorted or customized. For users signed in with UNP, these selections are preserved from session to session.
JOURNAL CITATION REPORTSJOURNAL BY RANK – marked list Permanently save your custom journal list
JOURNAL CITATION REPORTSCATEGORIES BY RANK – data grid On the Categories by Rank data grid, if users click the category name, they are taken to the Category Data Page for that selected category, if they click the number of journals for a category, they are taken to the Journals by Rank page for that category and year, if they click the numbers for any hyperlinked indicator in the grid, a pop-up displaying the calculations behind that indicator value will display:
On Categories by Rank, this is the left navigation bar: "Go to Journal Profile" is a master search tool. "Select Journals" and "Select Categories" allow the user to filter the data grid based on journal title or category name. Please note that in the Categories by Rank section, the resulting data grid will contain category-level data and the visualization will also display at the category level. "Select JCR Year" allows users to choose the year of the category-level data they wish to view. "Select Edition" allows users to choose which edition, Science Citation Index-Expanded or Social Science Citation Index, they wish to browse. Clicking "Clear" will restore the default view; clicking "Submit" will submit the selections and refresh the data grid. JOURNAL CITATION REPORTSCATEGORIES BY RANK – filtering options View summary information for each subject area. Easily navigate all prior editions back to 1997 and combined Science and Social Science editions. Now available for all customers.
JOURNAL CITATION REPORTSCATEGORIES BY RANK – aggregate data Clicking any hyperlinked value will pop up a window displaying the calculations behind that value. Clicking on "Graph" in any column will bring up a graph of the relevant indicator or data point in the space below the table.
JOURNAL CITATION REPORTSCATEGORIES BY RANK – aggregate data In addition to the raw aggregate data there are several additional points of information which help you understand the category as a whole.
JOURNAL CITATION REPORTSCATEGORIES BY RANK – features • Frequency of Publications graph: distribution of publication frequency among the journals in the category: • Category Box Plot: journal impact factor range for the category • Aggregate Source Data: all the citable items for the category • Cited and Citing category data, incorporating: • Aggregate Cited or Citing Half-Life data chart • Aggregate Cited or Citing Category graph • Aggregate Cited or Citing Category data table • All data from all sections of the Category Profile Page may be exported, using the icon at the top right of the page. PDF format will download the graphs. CSV and XLS formats will download the data tables.
JOURNAL CITATION REPORTSJOURNAL BY RANK – link and node visualization JCR contains a dynamic and interactive node and link visualization, which changes based on a user's selections. • On the Journals by Rank page, the nodes represent journals, the size of the nodes represents the journal impact factor, and the thickness of the linking lines show the strength of the relationship between the journals. • The visualization displays 25 nodes in a single view. Users can access the next 25 by clicking the arrows within the visualization. • Hovering over a node will pop up the journal's impact factor. • Clicking the journal node will take users to the journal profile page for that journal. • The visualization can be hidden and recovered by clicking "Hide Visualization" and "Show Visualization" in the upper right corner of the page.
JOURNAL CITATION REPORTSJOURNAL BY RANK – link and node visualization
JOURNAL CITATION REPORTSJOURNAL BY RANK – data grid Several features are available and accessed through the data grid view of journal rankings: • Check box: creates list for either Compare Journals or saving journals to a Marked List • Ability to sort on any column • Pop-ups reveal the calculations behind data points • Customize the data grid view to include: • JCR abbreviated title • Total Cites • Journal Impact Factor • Impact Factor without Journal Self-cites • 5-year Impact Factor • Immediacy Index • Citable Items • Cited Half-Life • Citing Half-life • Eigenfactor Score • Article Influence Score • Customized grid views are preserved for users logged in via UNP • Clicking a journal title will take users to the profile page for the selected journal
Many filtering options (Journal Profile, Journals, Categories, JCR Year, & Edition) are the same as on the Categories by Rank page. “Compare Journals” will take users to the Compare Journals component. “View Title Changes” shows the title changes for the selected JCR Year. “Select Category Scheme” allows users to view ranked lists of journal using either the WOS or ESI category scheme. “JIF Quartile” allows users to choose which quartile’s journals to view “Select Publisher” and “Select Country/Territory” allow users to filter based on publisher or country of origin. “Impact Factor Range” allows users to choose their preferred range of Impact Factor via a drop-down list. JOURNAL CITATION REPORTSJOURNAL BY RANK – filtering
JOURNAL CITATION REPORTSJOURNAL BY RANK – filtering Search for specific journals to create a custom list. Auto-completes any title you type in
JOURNAL CITATION REPORTSJOURNAL BY RANK – filtering Select a subject category or categories to see all journals
JOURNAL CITATION REPORTSJOURNAL BY RANK – filtering Easily navigate to previous editions of the JCR to view trends. All customers have access to the full archive back to 1997
JOURNAL CITATION REPORTSJOURNAL BY RANK – filtering All customers have access to both Science and Social Sciences editions of the JCR at the same time. For the first time it is possible to group journals by the Essential Science Indicators subject classification schema of 22 disciplines
JOURNAL CITATION REPORTSJOURNAL BY RANK – filtering Limit your analysis to only those journals in certain quartiles of their subject area Or limit to a specific range of Impact Factors
JOURNAL CITATION REPORTSJOURNAL BY RANK – journal profile page Click the Journal title to view the journal profile
JOURNAL CITATION REPORTSJOURNAL BY RANK – journal profile page The top of the Journal Profile Page contains the name of the journal, publishing information, title information, category listings (hovering over the category name will pop up Scope Notes for that category), languages, publication frequency, and whether or not that journal is an Open Access (OA) title. Links to Current Contents Connect and Ulrich's also appear in this section.
JOURNAL CITATION REPORTSJOURNAL BY RANK – key indicators • Directly below the journal information is a table containing all of the key indicators for that journal. This table contains data for all the years of coverage. For years the journal was not covered or was suppressed, data columns are marked as "Not Available." Also, data columns may indicate "Not Available" if the particular indicator had not yet been included in JCR. • As on the ranking page, clicking any hyperlinked value will pop up a window displaying the calculations behind that value. Clicking on "Graph" in any column will bring up a graph of the relevant indicator or data point in a tab on the left navigation pane marked "Metric Indicators."
JOURNAL CITATION REPORTSJOURNAL BY RANK – graphs The default view for a metric trend graph is the most recent five years. However, if a user clicks "View All Years" in the upper right corner of the graph, all available year data will display, which can again be collapsed by clicking "View Last 5 Years" in the upper right corner:
JOURNAL CITATION REPORTSJOURNAL BY RANK – source data The source data table displays the citable items that went into calculating the journal impact factor. The hyperlinked number in the Combined column will take users to a document list view, showing all the documents that were included in the calculation of the journal's impact factor. On the document page, hyperlinked titles will take the user to the document in the Web of Science. Users can utilize the breadcrumbs to return to the Journal Profile Page.
JOURNAL CITATION REPORTSJOURNAL BY RANK – other features • Rank in Category graphs using both Web of Science and ESI category schemes • Cited and Citing Journal Data • Aggregate Cited/Citing Half-Life data chart • Aggregate Cited/Citing Journal graph • Aggregate Cited/Citing Journal data table • Box Plot graph for each category in which the journal is classified • Ego Network graph for the journal, using either Journal Impact Factor or Market Share views, based on either cited or citing data • All data from all sections of the Journal Profile Page may be exported, using the icon at the top right of the page. PDF format will download the graphs. CSV and XLS formats will download the data tables. Download the full tables in Excel format directly from JCR (restrictions may apply)
JOURNAL CITATION REPORTSMASTER SEARCH If a user knows the journal they would like to see, they can utilize the Master Search box, which is accessible in the upper left corner of both the Categories by Rank and Journals by Rank pages: The Master Search box contains an auto-complete function; users can enter a partial search term and a drop-down menu featuring the top matches will appear and continue to refresh based on each keystroke. Once the user sees the title they wish to go to in the drop-down, they can click on it and be taken directly to the selected journal's profile page.
JOURNAL CITATION REPORTSCOMPARE JOURNALS The Compare Journals analysis and reporting component may be accessed in two ways: • Accessing this component from the left navigation menu on the Journals by Rank page will take users to a completely blank slate version of the Compare Journals page. • Users can select journals from the checkboxes on the ranking list and click "Compare Journals." This will bring users to the Compare Journals page with their selections ready for comparison.
JOURNAL CITATION REPORTSCOMPARE JOURNALS – quartile comparison Quartile Comparison compares a set of journals based on pre-selected metric calculations. Users will select their journals to compare (unless they have already populated this field on the Journals by Rank page), JCR year (this analysis is restricted to one year at a time), Metrics (more than one metric may be selected by holding down the Control key while making selections), and Subject Category. After selections have been made, click "Submit," and the comparison analysis is generated.
JOURNAL CITATION REPORTSCOMPARE JOURNALS – trends comparison Trends Comparison compares a set of journals in terms of trending data over time. Users will select their journals to compare (unless they have already populated this field on the Journals by Rank page), JCR year (more than one year may be selected by holding down the Control key while making selections), Metrics (this analysis is restricted to one metric at a time), and Subject Category. After selections have been made, click "Submit," and the comparison analysis is generated.
JOURNAL CITATION REPORTSCOMPARE JOURNALS – saving and exporting Users can save their journal comparison reports for later access by clicking "Save" and following the prompts in the pop-up: Users can export their reports to their local systems by clicking the download icon in the upper right of the screen: Quartile comparison reports download in CSV or XLS format; Trends comparison reports download in PDF format.
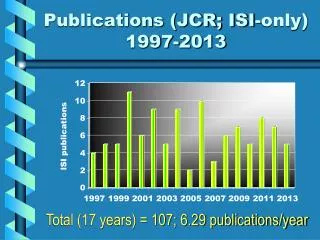
ESSENTIAL SCIENCE INDICATORS • Value Proposition • Benchmark (through third parties data) the research performance of people, institutions, countries, journals and papers again field baselines. • Keep us on global research trends by monitoring for highly cited (excellence) and hot papers (innovation) and research fronts in a range of disciplines • Research producing organisations: rank your institution among the top 1% of highly cited institutions globally. • Research funding organisations: identify which institutions are producing high impact papers. • Provide data (percentiles and threshold) that can be used for several other applications.
ESSENTIAL SCIENCE INDICATORS • Data • Over 10 million items from over 11,000 ISI indexed journals • Articles, reviews, proceedings papers, research notes • Does not include letters, editorial material, etc. • 10-year rolling file • Updated every 2 months
ESSENTIAL SCIENCE INDICATORS • Fields of Research • Multidisciplinary tool covering 22 discipline areas. • Scope notes for each field can be found on In-Cites webpage at http://sciencewatch.com/about/met/ Agricultural Sciences Biology & Biochemistry Chemistry Clinical Medicine Computer Science Ecology/Environment Economics & Business Engineering Geosciences Immunology Material Sciences Mathematics Microbiology Molecular Biology & Genetics Multidisciplinary Neuroscience & Behavior Pharmacology & Toxicology Physics Plant & Animal Science Psychology/Psychiatry Social Sciences, general Space Science
ESSENTIAL SCIENCE INDICATORS • Citation thresholds • Only the most highly cited individuals, institutions, journals, countries and papers will be found in the database. • Inclusion in ESI is dependent upon meeting the citation thresholds shown below.
NEW DESIGN: GLOBAL HEADER The top of the page contains the global header to access all products in the subscriber's suite. Below that users can access the Indicators data pages (default view), the Field Baselines, and the Citation Thresholds. "Indicators" is the main data page. Field Baselines and Citation Thresholds are nearly identical to those found in the legacy ESI interface; their front and center location makes for easy reference for users.