Download
1 / 31
310 likes | 436 Vues
This presentation, delivered at the GCTM Conference, outlines NSF-funded initiatives aimed at improving introductory statistics through authentic, career-specific discovery learning projects. Supported by two NSF grants, the project focuses on developing and refining curriculum materials that engage students in real-world data analysis. Key components include measuring specific student outcomes, collecting authentic data, and encouraging students to investigate their own research questions. The presentation also highlights various project types and evaluation methods, providing resources for educators and students.

E N D
Student Projectsin Statistics GCTM Conference October 14, 2010 Dianna Spence NGCSU Math/CS Dept, Dahlonega, GA
Background: NSF Grants • The material shared in this presentation is the product of work supported by 2 NSF Grants. • Phase I Grant (2007-2010) “Authentic, Career-Specific Discovery Learning Projects in Introductory Statistics” • Developed and pilot tested curriculum materials to facilitate discovery projects in statistics • Measured 3 specific student outcomes • Phase II Grant (2010-2014)“Discovery Learning Projects in Introductory Statistics” • Refine & improve materials • Pilot test nationally • Improve assessment of outcomes
Website Resources http://radar.northgeorgia.edu/~djspence What’s on this website? • This presentation • NSF Main Project Information Page • Phase I Instructional Materials (OLD) • Phase II Instructional Materials • These will be posted as they are developed over the next year
Types of Projects • t-tests* • Designs • 1-Sample • 2 Independent samples • 2 Dependent samples • Linear regression* • Chi-squared tests • *Part of NSF supported work
Project Tasks for Students • Identifying research questions • Defining specific variables • Data collection • Finding sources of data • Designing surveys if applicable • Identifying & implementing a sampling strategy • Organizing and recording data • Appropriate analysis of data • Interpretation of results • Reporting results (written and oral)
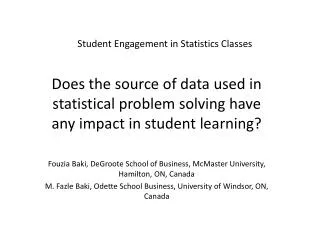
Today’s Focal Points Where can students get authentic data? What kinds of research questions do students investigate? How are student outcomes measured? Evaluation of student work Assessing the benefit of projects/materials Improving our instruments and findings
Collecting Data: 3 Categories • Administer surveys • Primary focus of Phase I materials • Makes survey design an element of the project • Find data on the Internet • Physically go out and record datae.g., measure items, time eventswith a stopwatch, look at prices, look at nutrition labels
Internet Data SourcesI. Government/Community • Census Bureau: http://www.census.gov/ • Georgia Statistics System: http://www.georgiastats.uga.edu/ • City Data Site: http://www.city-data.com/ • Bureau of Justice Statistics: http://bjs.ojp.usdoj.gov/index.cfm?ty=daa • Georgia Dep’t. of Education reporting page: http://www.doe.k12.ga.us/datareporting.aspx • Georgia Tax Assessors: http://gaassessors.com/
Internet Data SourcesII. Restaurants: Nutrition Info • Applebees: http://www.applebees.com/downloads/nutritional_info.html • Arby’s: http://www.arbys.com/nutrition/Arbys_Nutrition_Website.pdf • Burger King: http://www.bk.com/cms/en/us/cms_out/digital_assets/files/pages/NutritionInformation.pdf • McDonalds: http://nutrition.mcdonalds.com/nutritionexchange/nutritionfacts.pdf • Ruby Tuesday’s: http://www.rubytuesday.com/assets/menu/pdf/informational/nutrition.pdf • Student’s favorite place to eat?
Internet Data SourcesIII. Sports Data • Sports Statistics Data Resources (Gateway) http://www.amstat.org/sections/SIS/Sports Data Resources/ • NFL Historical Stats: http://www.nfl.com/history • Individual team sites
Internet Data SourcesIV. Retail/Consumer (General) • Cost/Prices • Consumer Report ratings .http://www.consumerreports.org/cro/index.htm • Product Specifications • e.g., size measurements,time/speed measurements,MPG for cars
Sample Student Projects • One Sample t-Test: • 1-tailed: Ha predicting that the average purebred Boston Terrier puppy in the U.S. costs more than $500 • Stratified sample representing different regions of the country • t statistic =1.73 • P value= 0.0449 • Conclusion: Evidence at 0.05 significance level that on average, purebred Boston Terrier puppies are priced higher than$500.00 in the U.S.
Sample Student Projects • Matched Pairs t-Test: • 1-tailed: Ha predicting on average, Wal-Mart prices would be lower than Target prices for identical items • t statistic =.4429 • P value= 0.3294 • Conclusion: Mean price difference not significant; insufficient evidence that Wal-Mart prices are lower Item WalMart Target 64-oz. Mott’s Juice 2.79 2.89 12-oz LeSeur Peas 1.19 1.08 . . .
Sample Student Projects • Matched Pairs t-Test: • 2-tailed: Ha predicting that on average, students’ rating of Coke and Pepsi would be different. • t statistic =2.62 • P value= 0.0116 (2-tailed) • Conclusion: Evidence that on average, students rated the two drinks differently (Coke was rated higher) Participant Coke Pepsi #1 8 9 #2 7 5 . . .
Sample Student Projects • t-Test for 2 independent samples: • 1-tailed: Ha predicting that on average fruit drinks have higher sugar content per ounce than fruit juices • t statistic = -0.14 • P value= 0.5555 • Conclusion: Sample data did not support Ha. No evidence that on average,fruit drinks have more sugar than fruit juices.
Sample Student Projects • t-Test for 2 independent samples: • 1-tailed: Ha predicting that in local state parks, oak trees have greater circumference than pine trees on average • t statistic = 4.78 • P value= 7.91 x 10 –6 • Conclusion: Strong evidence that in local state parks oak trees are bigger than pine trees on average. • Lurking variable identifiedand discussed: age of trees (and possible reasons that oak trees were older)
Online Resource:Materials for Students (OLD) • Student Guide • Overall Project Guide • Help for each project phase • Technology Guide • Variables and Constructs
Online Resource:Instructional Materials (OLD) • Instructor Guide • Project overview • Timelines • Implementation tips • Best practices • Handouts for different project phases • Evaluation rubrics • Links to student resources
Assessment • Scoring Rubrics • Advantages • Consistency • Manageability • Communicate expectations • Encompass All Project Components • Grade milestones along the way • Resources for Rubrics
Phase I Assessment of Outcomes • Varied by Instructor • Overall results given here • Instrument • Perceived Usefulness • Pretest: 50.42 • Posttest: 51.40 • Significance: p = 0.208 • Self-Beliefs for Statistics • Pretest: 59.64 • Posttest: 62.57 • Significance: p = 0.032** • Content Knowledge • Pretest: 6.78 • Posttest: 7.21 • Significance: p = 0.088*
Qualitative Findings:Student Feedback Student Quotes Shared by Instructors “While our results did not meet our initial expectations, this is not an utter disappointment. Before this project, statistics looked simple enough for anyone to sit down and do, but now it is evident that it requires more creativity and critical thinking than initially expected. Overall, it was an edifying experience.” “The main thing that we have learned is that statistics take time. They cannot be conjured up by a few formulas in a few minutes. The time and effort that is put into a small research project such as this is significant. On a large scale, one can quickly understand the kind of commitment of money and time that is required just to obtain reasonable data.”
Improving Our Assessments • Perceived Usefulness • Reduce/eliminate focus on career • Content Knowledge • Add questions to reflect what student knows about conducting research • Data collection methods • Sampling strategies • Organizing and analyzing data
Website Resources http://radar.northgeorgia.edu/~djspence What’s on this website? • This presentation • NSF Main Project Information Page • Phase I Instructional Materials (OLD) • Phase II Instructional Materials • These will be posted as they are developed over the next year