New Seven QC Tools Training - Increase Quality Control Efficiencies
770 likes | 1.04k Vues
A detailed training presentation on the New Seven Quality Control Tools by Christopher Diaz, showcasing techniques such as Affinity Diagrams, Tree Diagrams, and Matrix Data Analysis.

New Seven QC Tools Training - Increase Quality Control Efficiencies
E N D
Presentation Transcript
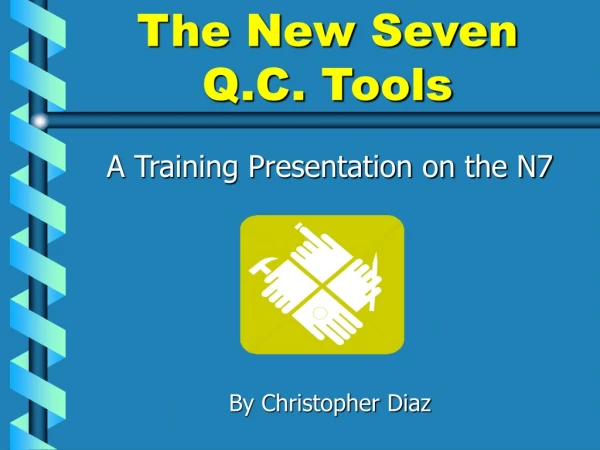
The New Seven Q.C. Tools A Training Presentation on the N7 By Christopher Diaz
What are the New Seven Q.C. Tools • Affinity Diagrams • Relations Diagrams • Tree Diagrams • Matrix Diagrams • Arrow Diagrams • Process Decision Program Charts • Matrix Data Analysis
History of the New Seven Q.C. Tools Slide 1 0f 2 • Committee of J.U.S.E. - 1972 • Aim was to develop more QC techniques with design approach • Work in conjunction with original Basic Seven Tools • New set of methods (N7) - 1977
History of the New Seven Q.C. Tools Slide 2 0f 2 • Developed to organize verbal data diagrammatically. • Basic 7 tools effective for data analysis, process control, and quality improvement (numerical data) • Used together increases TQM effectiveness
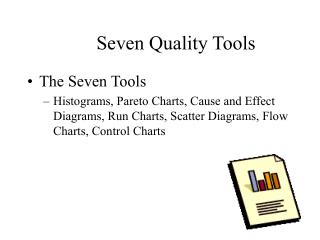
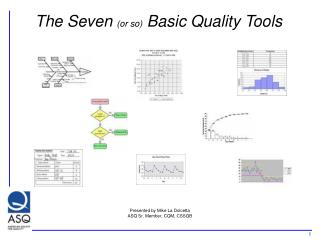
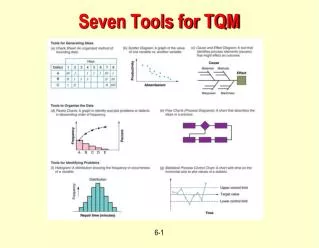
What are the Basic Seven Q.C. Tools? • Flow Charts • Run Charts • Histograms • Pareto Diagrams • Cause and Effect Diagrams • Scatter Diagrams • Control Charts
Relation Between New Seven Q.C. Tools and Basic Seven Tools FACTS Data Numerical Data Verbal Data Define problem after collecting numerical data Define problem before collecting numerical data The Basic Seven Tools The Seven New Tools • Analytical approach • Generate Ideas • Formulate plans Organize Information Source: Nayatani, Y., The Seven New QC Tools (Tokyo, Japan, 3A Corporation, 1984)
Benefits of Incorporating New Seven Q.C. Tools Slide 1 0f 4 Enhanced Capabilities • Organize verbal data • Generate ideas • Improve planning • Eliminate errors and omissions • Explain problems intelligibly • Secure full cooperation • Persuade powerfully
Benefits of Incorporating New Seven Q.C. Tools Slide 2 0f 4 Enhanced Keys to Organizational Reform • Assess situations from various angles • Clarify the desired situation • Prioritize tasks effectively • Proceed systematically • Anticipate future events • Change proactively • Get things right the first time
Benefits of Incorporating New Seven Q.C. Tools Slide 3 0f 4 Five Objectives of Organizational Reform which will establish a Culture that: • Identifies problems • Gives importance to planning • Stresses the importance of the process • Prioritizes tasks • Encourages everyone to think systematically
Benefits of Incorporating New Seven Q.C. Tools Slide 4 0f 4 Unstructured Problem[must be put into solvable form] The Seven New Tools Problem is mapped Problem becomes obvious to all Thoughts are easily organized Plans are easily laid Problem becomes obvious to all People understand problem Problem can be clearly articulated Nothing is omitted Nub of problem is identified Things go well Countermeasures are on target Cooperation is obtained Problem is in solvable form Source: Nayatani, Y., The Seven New QC Tools (Tokyo, Japan, 3A Corporation, 1984)
New Seven Q.C. Tools Affinity Diagrams Slide 1 0f 7 For Pinpointing the Problem in a Chaotic Situation and Generating Solution Strategies • Gathers large amounts of intertwined verbal data (ideas, opinions, issues) • Organizes the data into groups based on natural relationship • Makes it feasible for further analysis and to find a solution to the problem.
New Seven Q.C. Tools Affinity Diagrams Slide 2 0f 7 Advantages of Affinity Diagrams • Facilitates breakthrough thinking and stimulate fresh ideas • Permits the problem to be pinned down accurately • Ensures everyone clearly recognizes the problem • Incorporates opinions of entire group
Topic Affinity Statement Affinity Statement Affinity Statement Data Card Data Card Data Card Data Card Data Card Data Card Data Card Data Card Data Card Data Card Data Card Data Card Data Card Data Card Affinity Statement Data Card Data Card Data Card New Seven Q.C. Tools Affinity Diagrams Slide 3 0f 7 Advantages of Affinity Diagrams (cont.) • Fosters team spirit • Raises everyone’s level of awareness • Spurs to the group into action
New Seven Q.C. Tools Affinity Diagrams Slide 4 0f 7 Constructing an Affinity Diagram Group Method Approach • Select a topic • Collect verbal data by brainstorming • Discuss info collected until everyone understands it thoroughly • Write each item on separate data card • Spread out all cards on table
New Seven Q.C. Tools Affinity Diagrams Slide 5 0f 7 Constructing an Affinity Diagram Group Method Approach (cont.) • Move data cards into groups of similar themes (natural affinity for each other) • Combine statements on data cards to new Affinity statement • Make new card with Affinity statement • Continue to combine until less than 5 groups
New Seven Q.C. Tools Affinity Diagrams Slide 6 0f 7 Constructing an Affinity Diagram Group Method Approach (cont.) • Lay the groups outs, keeping the affinity clusters together Next, complete the diagram
Topic Affinity Statement Affinity Statement Affinity Statement Data Card Data Card Data Card Data Card Data Card Data Card Data Card Data Card Data Card Data Card Data Card Data Card Data Card Data Card Affinity Statement Data Card Data Card Data Card New Seven Q.C. Tools Affinity Diagrams Slide 7 0f 7 Completing an Affinity Diagram Source: Nayatani, Y., The Seven New QC Tools (Tokyo, Japan, 3A Corporation, 1984)
New Seven Q.C. Tools Relations Diagrams Slide 1 0f 7 For Finding Solutions Strategies by Clarifying Relationships with Complex Interrelated Causes • Resolves tangled issues by unraveling the logical connection • Allows for “Multi-directional” thinking rather than linear • Also known as Interrelationship diagrams
New Seven Q.C. Tools Relations Diagrams Slide 2 0f 7 Advantages of Relations Diagrams • Useful at planning stage for obtaining perspective on overall situation • Facilitates consensus among team • Assists to develop and change people’s thinking • Enables priorities to be identified accurately
Tertiary Cause Tertiary Cause Secondary Cause Primary Cause Primary Cause Tertiary Cause Secondary Cause Why doesn’t X happen? Secondary Cause Primary Cause Primary Cause 6th level Cause Secondary Cause Tertiary Cause Tertiary Cause Secondary Cause 4th level Cause 4th level Cause 5th level Cause New Seven Q.C. Tools Relations Diagrams Slide 3 0f 7 Advantages of Relations Diagrams (cont.) • Makes the problem recognizable by clarifying the relationships among causes
New Seven Q.C. Tools Relations Diagrams Slide 4 0f 7 Constructing a Relations Diagram Group Method Approach • Express the problem in form of “Why isn’t something happening?” • Each member lists 5 causes affecting problem • Write each item on a card • Discuss info collected until everyone understands it thoroughly
New Seven Q.C. Tools Relations Diagrams Slide 5 0f 7 Constructing a Relations Diagram Group Method Approach (cont.) • Move cards into similar groups • Asking why, explore the cause-effect relationships, and divide the cards into primary, secondary and tertiary causes • Connect all cards by these relationships • Further discuss until all possible causes have been identified
New Seven Q.C. Tools Relations Diagrams Slide 6 0f 7 Constructing a Relations Diagram Group Method Approach (cont.) • Review whole diagram looking for relationships among causes • Connect all related groups Next, complete the diagram
Tertiary Cause Tertiary Cause Secondary Cause Primary Cause Primary Cause Tertiary Cause Secondary Cause Why doesn’t X happen? Secondary Cause Primary Cause Primary Cause 6th level Cause Secondary Cause Tertiary Cause Tertiary Cause Secondary Cause 4th level Cause 4th level Cause 5th level Cause New Seven Q.C. Tools Relations Diagrams Slide 7 0f 7 Completing a Relations Diagram Source: Nayatani, Y., The Seven New QC Tools (Tokyo, Japan, 3A Corporation, 1984)
New Seven Q.C. Tools Tree Diagrams Slide 1 0f 5 For Systematically Pursuing the Best Strategies for Attaining an Objective • Develops a succession of strategies for achieving objectives • Reveals methods to achieve the results. • Also known as Systematic diagrams or Dendrograms
4th means 3rd means 4th means Secondary means 4th means 3rd means Primary means 4th means 3rd means To Accomplish 4th means 3rd means Secondary means 4th means 4th means Constraints New Seven Q.C. Tools Tree Diagrams Slide 2 0f 5 Advantages of Tree Diagrams • Systematic and logical approach is less likely that items are omitted • Facilitates agreement among team • Are extremely convincing with strategies
New Seven Q.C. Tools Tree Diagrams Slide 3 0f 5 Constructing a Tree Diagram Group Method Approach • Write Relations Diagram topic (Objective card) • Identify constraints on how objective can be achieved • Discuss means of achieving objective (primary means, first level strategy) • Take each primary mean, write ob-jective for achieving it (secondary means)
New Seven Q.C. Tools Tree Diagrams Slide 4 0f 5 Constructing an Tree Diagram Group Method Approach (cont.) • Continue to expand to the fourth level • Review each system of means in both directions (from objective to means and means to objective) • Add more cards if needed • Connect all levels Next, complete the diagram
4th means 3rd means 4th means Secondary means 4th means 3rd means Primary means 4th means 3rd means 4th means 3rd means Secondary means To Accomplish 4th means 4th means 3rd means 4th means Secondary means 4th means 3rd means 4th means Primary means 3rd means Constraints 4th means Secondary means 3rd means 4th means New Seven Q.C. Tools Tree Diagrams Slide 5 0f 5 Completing a Tree Diagram Source: Nayatani, Y., The Seven New QC Tools (Tokyo, Japan, 3A Corporation, 1984)
New Seven Q.C. Tools Matrix Diagrams Slide 1 0f 7 For Clarifying Problems by “Thinking Multidimensionally” • Consists of a two-dimensional array to determine location and nature of problem • Discovers key ideas by relationships represented by the cells in matrix.
New Seven Q.C. Tools Matrix Diagrams Slide 2 0f 7 Advantages of Matrix Diagrams • Enable data on ideas based on extensive experience • Clarifies relationships among different elements • Makes overall structure of problem immediately obvious • Combined from two to four types of diagrams, location of problem is clearer.
New Seven Q.C. Tools Matrix Diagrams Slide 3 0f 7 Advantages of Matrix Diagrams (cont.) • 5 types: L-shaped, T-shaped, Y-shaped, X-shaped, and C-shaped
New Seven Q.C. Tools Matrix Diagrams Slide 4 0f 7 Constructing a Matrix Diagram • Write final-level means from Tree diagram forming vertical axis • Write in Evaluation categories (efficacy, practicability, and rank) on horizontal axis. • Examine final-level means to identify whom will implement them • Write names along horizontal axis
New Seven Q.C. Tools Matrix Diagrams Slide 5 0f 7 Constructing a Matrix Diagram (cont.) • Label group of columns as “Responsibilities” • Label right-hand end of horizontal axis as “Remarks” • Examine each cell and insert the appropriate symbol: Efficacy: O=good, =satisfactory, X=none Practicability: O=good,=satisfactory, X=none
New Seven Q.C. Tools Matrix Diagrams Slide 6 0f 7 Constructing a Matrix Diagram (cont.) • Determine score for each combination of symbols, record in rank column • Examine cells under Responsibility Columns, insert double-circle for Principal and single-circle for Subsidiary • Fill out remarks column and record meanings of symbol Next, complete the diagram
New Seven Q.C. Tools Matrix Diagrams Slide 7 0f 7 Completing a Matrix Diagram Source: Nayatani, Y., The Seven New QC Tools (Tokyo, Japan, 3A Corporation, 1984)
New Seven Q.C. Tools Arrow Diagrams Slide 1 0f 7 For Working Out Optimal Schedules and Controlling Them Effectively • Shows relationships among tasks needed to implement a plan • Network technique using nodes for events and arrows for activities • Used in PERT (Program Evaluation and Review Technique) and CPM (Critical Path Method)
New Seven Q.C. Tools Arrow Diagrams Slide 2 0f 7 Advantages of Arrow Diagrams • Allows overall task to viewed and potential snags to be identified before work starts • Leads to discovery of possible improvements • Makes it easy to monitor progress of work • Deals promptly with changes to plan • Improves communication among team
Strategy Constraints 4 12 1 2 3 5 9 10 13 Activity 6 8 11 7 New Seven Q.C. Tools Arrow Diagrams Slide 3 0f 7 Advantages of Arrow Diagrams (cont.) • Promotes understanding and agreement among group
New Seven Q.C. Tools Arrow Diagrams Slide 4 0f 7 Constructing an Arrow Diagram • From strategies on Tree diagram, select one (Objective of Arrow Diagram) • Identify constraints to Objective • List all activities necessary to achieving Objective • Write all essential activities on separate cards
New Seven Q.C. Tools Arrow Diagrams Slide 5 0f 7 Constructing an Arrow Diagram (cont.) • Organize cards in sequential order of activities • Remove any duplicate activities • Review order of activities, find sequence with greatest amount of activities • Arrange parallel activities
New Seven Q.C. Tools Arrow Diagrams Slide 6 0f 7 Constructing an Arrow Diagram (cont.) • Examine path, number nodes in sequence from left to right • Record names and other necessary information Next, complete the diagram
Strategy Constraints 4 12 1 2 3 5 9 10 13 Activity 6 8 11 7 New Seven Q.C. Tools Arrow Diagrams Slide 7 0f 7 Completing an Arrow Diagram Source: Nayatani, Y., The Seven New QC Tools (Tokyo, Japan, 3A Corporation, 1984)
New Seven Q.C. ToolsProcess Decisions Program Charts Slide 1 0f 7 For Producing the Desired Result from Many Possible Outcomes • Used to plan various contingencies • Used for getting activities back on track • Steers events in required direction if unanticipated problems occur • Finds feasible counter measures to overcome problems
New Seven Q.C. ToolsProcess Decisions Program Charts Slide 2 0f 7 Advantages of Process Decisions Program Charts (PDPC’s) • Facilitates forecasting • Uses past to anticipate contingencies • Enables problems to pinpointed • Illustrates how events will be directed to successful conclusion • Enables those involved to understand decision-makers intentions
Start NO NO NO NO YES YES NO NO YES NO GOAL New Seven Q.C. ToolsProcess Decisions Program Charts Slide 3 0f 7 Advantages of PDPC’s (cont.) • Fosters cooperation and communication in group • Easily modified and easily understood
New Seven Q.C. ToolsProcess Decisions Program Charts Slide 4 0f 7 Constructing a PDPC • Select a highly effective, but difficult strategy from the Tree diagram • Decide on a goal (most desirable outcome) • Identify existing situation (Starting point) • Identify constraints of objective • List activities to reach goal and potential problems with each activity
New Seven Q.C. ToolsProcess Decisions Program Charts Slide 5 0f 7 Constructing an PDPC (cont.) • Review list. Add extra activities or problems not thought of previously • Prepare contingency plan for each step and review what action is needed if step is not achieved • Examine carefully to check for inconsistencies and all important factors are included
New Seven Q.C. ToolsProcess Decisions Program Charts Slide 6 0f 7 Constructing an PDPC (cont.) • Examine to make sure all contingency plans are adequate Next, complete the diagram
Start NO NO NO NO YES YES NO NO YES NO GOAL New Seven Q.C. ToolsProcess Decisions Program Charts Slide 7 0f 7 Completing a PDPC Source: Nayatani, Y., The Seven New QC Tools (Tokyo, Japan, 3A Corporation, 1984)