Download
1 / 30
330 likes | 669 Vues
Sustainable indicators footprints as examples. Alon Shepon. outline. Indicators in general Ecological footprint Water footprint Carbon footprint. definition.

E N D
outline • Indicators in general • Ecological footprint • Water footprint • Carbon footprint
definition • Measurement tools to quantitatively assess the appropriation of ecosystem services, resources, and establish the environmental load. • We encountered LCA, MFA, EIOLCA, Net energy Analysis. • We will examine three other frameworks to assess sustainability
Yield factor production Equivalence factor ecological footprint yield biocapacity Land available Ecological footprint analysis Land type is divided into 6 types, grazing (meat, wool), crop (food fodder, oil etc), forest (timber, fuel, rubber), build-up (transportation, industry), fish, burning fossil fuel.
Area to produce product i with world yield Area to produce product i with national yield Yield factor (YF) calculation
The equivalence convert land type into world average biologically productive area: global hectare EQF(gha/ha) 2005 Primary Cropland 2.64 Forest 1.33 Grazing Land 0.50 Marine 0.40 Carbon 1.33 Built-up Land 2.64 Trade - the footprint of consumption is basically the products and services produced for local consumption minus the import
Overshoot Earth Overshoot Day marks the day when humanity begins living beyond its ecological means: [ world biocapacity / world Ecological Footprint ] x 365 = Ecological Debt Day
Water footprint of a product ► the volume of fresh water used to produce the product, summed over the various steps of the production chain. ► when and where the water was used: a water footprint includes a temporal and spatial dimension.
Water footprint of a product Blue water footprint ► volume of surface or groundwater consumed (not returned immeditely to catchment) Blue = BlueWaterEvap+BlueWaterIncop+LostRetunFlow Green water footprint ► volume of rainwater consumed Green = GreenwaterEvap+GreenwaterIncop Grey water footprint • ► volume of polluted water, the amount of water needed to dilute to standard acceptable level:
Assessing the water footprintof crop and animal products Water footprint of a crop Crop water use (m3/ha) / Crop yield (ton/ha) Water footprint of an animal Sum of water for feed, drinking and servicing Water footprint of a crop or livestock product Distribute the water footprint of the root product over its derived products
Crop water requirement • Calculate reference crop evapotranspiration ET0 (mm/day) • Calculate crop evapotranspiration Etc (mm/day) • Etc=ET0Kc where Kc = crop coefficient • Calculate crop water requirement CWR (m3/ha) • CWR = Σ Etc [accumulate over growing period]
Green water use by crop = min (Etc, Peff) Blue water use by crop = max(Etc - Peff, 0)
Water footprint of biofuels from different crops [litre/litre] [Gerbens-Leenes, Hoekstra & Van der Meer, 2009]
Production chain cotton 45% 41% 14% 2.6 *1011 m3 water 3.5% from all crops
Water footprint of a nation • ► total amount of water that is used to produce the goods and services consumed by the inhabitants of the nation. National water footprint =water footprint within country + virtual water import– virtual water export
Regional virtual water balances(only agricultural trade) Arrows show trade flows >10 Gm3/yr [Hoekstra & Chapagain, 2008]
Global average water footprint Water footprint per capita [Hoekstra & Chapagain, 2008]
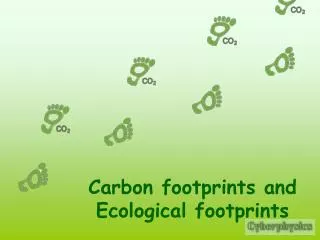
Carbon footprint analysis The total amount of greenhouse gases produced directly and indirectly to support human activities, usually expressed in equivalent tons of carbon dioxide (CO2)
Sum up • Footprints are indicators of sustainability, valuable tools for policy and decision making • Reduce a complex analysis into a scalar figure • Their simplicity is their Achilles heel • Other sustainable indicators exist; alternatively a combination can reveal a broader picture • Research is needed to acquire new methodologies and improve existing indicators
More info • www.footprintnetwork.org – full of info on the ecological footprint including annual reports and the science behind. • Our ecological footprint, reducing the Human’s impact on earth, M. Wackernagel and W. Reed, 1996 • Water footprint - http://www.waterfootprint.org/?page=files/home