Investigation of Sheen and Ebullition at McCormick & Baxter Superfund Site
170 likes | 258 Vues
This study aims to understand sheen and gas ebullition mechanisms at the McCormick & Baxter Superfund Site in Portland, Oregon, to assess the protective nature of the current cap and remedial measures needed.

Investigation of Sheen and Ebullition at McCormick & Baxter Superfund Site
E N D
Presentation Transcript
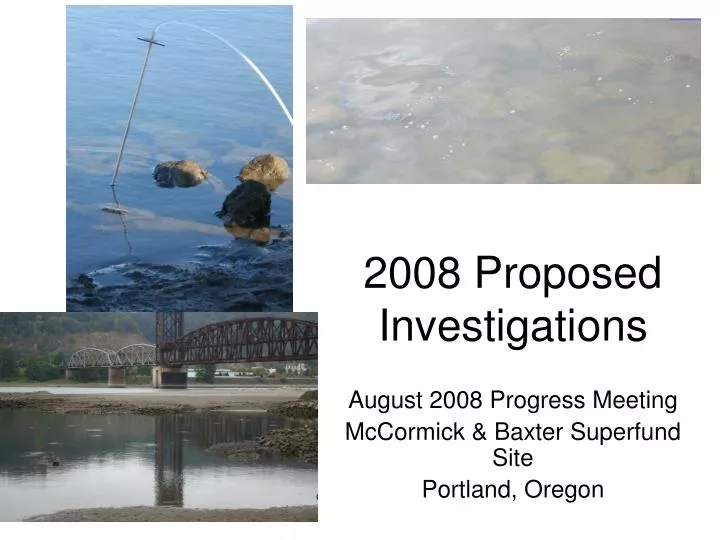
2008 Proposed Investigations August 2008 Progress Meeting McCormick & Baxter Superfund Site Portland, Oregon
Three Outstanding Concerns • Sheens along bank during times of gw discharge and in TFA and Willamette Cove • Ebullition as a contaminant pathway • Observe prolific ebullition in bulk OC area in TFA – what is the potential for the OC to degrade Purpose – Determine the mechanism and significance of sheen and ebullition with the overarching goal of understanding whether the cap is protective or whether additional remedial measure are required
Photos of Sheen July 2008
Spring 2008 River HydrographPortland River Stage Sheen first observed 2008
Sheen Surveys • June – no sheen observed during shoreline walk at low tide • July 10 – no sheen observed during shoreline walk, low tide • July 14 – sheen first observed at site by Newt • July 16 – sheen observed along WC and WR banks, low tide • July 22 – sheen observed along WC and WR shoreline, low tide • July 31 – no sheen; no odor along entire bank, low tide
Contaminant Release via Gas Ebullition Relatively low – unless NAPL entrained in gas bubbling to surface
Ebullition Survey • July 31 2008 – Boat survey and GPS of ebullition • High tide at 5 AM at 11.96 feet NAVD88 • Low tide at 3:15 PM – 8.22 feet NAVD88 • Conducted kayak sweep between 9:30 AM and 12:30 PM and again between 1:30 PM and 3:30 PM – recording bubble locations and measuring rates as feasible
Survey Results 9:30 to 12:30: River Level between 10 and 9 feet NAVD88 • Ebullition almost exclusively over granular organoclay in WC and TFA • Bubbling fairly continuous and ubiquitous in these areas (i.e., 100’s of bubble locations in each area) • Rate fairly consistent at approximately 1/3 liter in 3 minutes (or approximately 0.1 liter per minute) per bubble pathway • Strong sulfur odor from gas in shallower areas (deeper water gas did not have a discernible odor) • Ebullition observed in other areas when waves from boat traffic are present - very inconsistent in flow rate and location • Only 3 locations observed over the OC mat 2 area • No creosote odors
Investigation Tasks • SPME, Cores, and Porewater Samples along a transect in the TFA and in Willamette Cove to measure contaminant distribution with the intent of understanding the contaminant migration pathway (UT with HC/GSI) • 10 co-located flux chamber samples over bubble pathways and next to bubble pathways – measuring the concentration of water and gas that discharges to determine whether there is a significant difference in discharge concentrations in areas of ebullition (HC/GSI) • Biodegradation study on cores to determine which zone is generating the most gas and attempt to determine what is being broken down (PSU) • Survey of locations and rates of ebullition through tidal cycle and season (HC/GSI) • Continued shoreline documentation of sheen (HC/GSI) • Sampling of sheen (July 2007) from 4 locations along shoreline – sediment, sheen on water and ambient surface water sample adjacent to sheen (HC/GSI)