Permafrost and changing climate: impacts on infrastructure
180 likes | 414 Vues
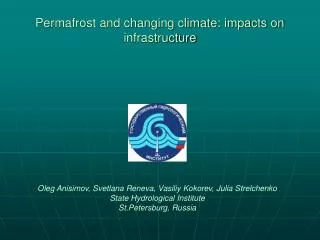
Permafrost and changing climate: impacts on infrastructure. Oleg Anisimov, Svetlana Reneva, Vasiliy Kokorev, Julia Strelchenko State Hydrological Institute St.Petersburg, Russia. Permafrost occupies more than 60% of Russia. Aerobic. Active layer. Water. CH 4. Permafrost.

Permafrost and changing climate: impacts on infrastructure
E N D
Presentation Transcript
Permafrost and changing climate: impacts on infrastructure Oleg Anisimov, Svetlana Reneva, Vasiliy Kokorev, Julia Strelchenko State Hydrological Institute St.Petersburg, Russia
Permafrost occupies more than 60% of Russia
Aerobic Active layer Water CH4 Permafrost Key concerns associated with thawing permafrost • Threats to ecosystems, loss of wildlife habitat, geopolitical issues • Vicinity of Yakytsk,2008. Photo: T.Maksimov • Permafrost and economy of the North: impacts on the infrastructure • Baikal-Amur main track. Photo: D.Drozdov • Permafrost and global climate: potential feedback through methane emission
Yedoma. Lower Kolyma river. Photo: Vladimir Romanovskiy Consecutive stages of ground subsidence leading to forest damage. Eroding coastline of East-Siberian sea. Photo: Mikhail Grigoriev, 2008 Vicinity of Yakytsk. Photo: Trofim Maksimov, 2008 Uneven soil subsidence and erosion due to thawing permafrost severely affect northern landscapes and destroy forests (lower photo), and expose organic-rich Yedoma sediments (upper photo). Calving permafrost blocks and erosion along the coasts of Russian Arctic seas lead up to 30 km2 /y land loss
Impacts of thawing permafrost on constructions ACIA, 2005 Yakutsk, July 2006. Building in Vorkuta, photo: D.Streletskiy
Photo: Mikhail Grigoriev, 2009 Photo: Sergei Marchenko, September 2009 Weather Station “Tien Shan”, damaged due to ice melt. Tien Shan, Central Asia, 3614 m ASL Facilities of Bykov Mys village, Laptev sea coast, affected by coast retreat and thawing permafrost. Photo: Mikhail Grigoriev, 2008 Photo: Dmitriy Drozdov, 2008 Baikal-Amur main track. Administrative building in Yakutsk, 2008.
Documented destructive impacts of thawing permafrost V. Grebenetz and Ye. Dmitriev, 2008
Air temperature, 0C Аa Аveg Аsn Аorg Тa ATMOSPHERE 0 0.3 0.6 0.8 1.0 1.2 1.4 -16 -12 -8 -4 0 4 hveg Тveg Air temperature amplitude, 0C vegetation hsn Тsn zorg Snow Тorg 18 20 22 24 26 28 Organic layer ТAL ALD Active layer Active-layer thickness, m Тp Permafrost Conventional permafrost modeling Input: gridded climate data Permafrost model
0 0.5 0.8 1.2 1.5 2.0+ Conventional permafrost modeling Conventional permafrost models predict permafrost parameters, i.e. ALT, soil temperature, under current and projected climate. ALT, baseline (1990-2000) ALT, 2050 projection based on 21 GCM ensemble under A2 emission scenario ALT, m
Permafrost hazard index, Ig Ig= k • (1+S)• (z2 – z1) • Cw/ z1 Zi– maximum summer thaw depth under the modern (index 1) and projected for the future (index 2) climate, Cw - volumetric ground ice content, S - soil salinity, K - constant scaling factor. Anisimov, Reneva 2006 Nelson, Anisimov, Shiklomanov, 2001, 2002
CGCM2 HadCM3 ECHAM4 CSM-1.4 GFDL-R30 Permafrost hazard index, 2050 projections low moderate high Anisimov et al., 2009
R24, Bolvansky 30 см R2, Ayach-Yakha 50 R23, Talnik R4, Parisento 70 , R3 R1, Nadym 30 50 70 90 130 150 90 110 130 Talik Small-scale random variations over space Organic layer thickness Active layer thickness
Probabilistic ALT mapping 30 50 70 90 130 150 Probability scale 0 0.2 0.4 0.6 0.8 1.0 ALT range <0.5 m 0.5 - 0.8 m 0.8 - 1.4 m 1.4 - 2.0 m
-5.0 -4.5 -4.0 -3.5 -3.0 -2.5 -2.0 -1.5 -1.0 -0.5 Design strength 2050, org=20 cm 2050, bare ground 2000, bare ground 2000, org=20cm Design safety factor (99%) -5.0 -4.5 -4.0 -3.5 -3.0 -2.5 -2.0 -1.5 -1.0 -0.5 0 Ground temperature, 0C Implications in engineering
Acknowledgement Support for this UK-Russia research comes from the Foreign Commonwealth strategic programme fund