Download
1 / 38
380 likes | 557 Vues
The Impact of Heart Disease and Stroke in Michigan: 2008 Report on Surveillance. November 3, 2008. Outline. Introduction to Cardiovascular Disease Diseases and Risk Factors in the Report Comparison of CVD in Michigan and U.S. Racial Disparities of CVD in Michigan

E N D
The Impact of Heart Disease and Stroke in Michigan:2008 Report on Surveillance November 3, 2008
Outline Introduction to Cardiovascular Disease Diseases and Risk Factors in the Report Comparison of CVD in Michigan and U.S. Racial Disparities of CVD in Michigan Geography of CVD in Michigan Risk Factors of CVD Future of CVD in Michigan
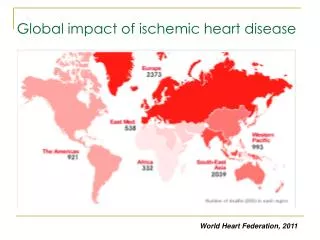
Introduction • Cardiovascular disease (CVD) refers to diseases of the heart and diseases of the blood vessels • 1 in 3 Americans report they have CVD • $448.5 billion will be spent on CVD in the United States in 2008 • Heart disease is the number 1 cause of death • Stroke is the number 3 cause of death
Diseases and their corresponding ICD codes discussed in the report
Cardiovascular Disease Risk Factors Smoking High Blood Pressure High Blood Cholesterol Diabetes Physical Inactivity Dietary Behavior Overweight and Obesity Risk Factor Clustering
Methods Age-Adjusted Rates: Populations often differ in their distribution of age, which may in turn affect the overall rate of events in that population. Therefore, when comparing rates of events in populations of different age distributions, it is important to account for those differences. 2000 US standard population was used to age-adjust. Prevalence: the proportion of individuals in a population who have the disease at a point in time or during a given time period. It is often used to describe the health burden on a given population. It is often multiplied by 100 and expressed as a percent. Data Suppression: Less than 20 events were suppressed Data Mapping: ArcGIS Map was used to create the maps seen in the report
Medical Resources in Michigan
Medical Control Authorities • 82,000 EMS responses in Michigan in 2006 • 60% of unexpected cardiac deaths are treated by EMS • 65 Medical Control Authorities in Michigan • Michigan is 1 of 4 states without a Trauma System
Hospitals • non-profit organizations that serve the community 24 hours a day, seven days a week • 147 Acute Care Hospitals in Michigan • 34 Critical Access Hospitals in Michigan’s rural communities Source: Michigan Health and Hospital Association, 2008
Primary Stroke Centers Michigan Stroke Network Source: The Joint Commission, 2008 Source: Michigan Stroke Network, 2008
Comparison of CVD in Michigan and U.S.
Leading Causes of Deathin Michigan and the United States Michigan, 2006 United States, 2005 Source: MDCH Division of Vital Records and Health Statistics, 2006 National Center of Health Statistics, Centers for Disease Control and Prevention, 2005
Age-Adjusted Mortality Rates for Cardiovascular Disease for Michigan and United States, 2000-2006 2005 Michigan: 297.2 United States: 277.3 Source: MDCH Vital Statistics Age-adjusted to the 2000 U.S. standard population
Age-Adjusted Mortality Rates for Michigan and United States compared to Healthy People 2010, 2000-2006 Coronary Heart Disease Stroke HP 2010: 162 (per 100,000) 2006 Michigan: 161.1 2005 United States: 144.4 HP 2010: 50 (per 100,000) 2006 Michigan: 46.4 2005 United States: 46.6 Source: MDCH Vital Statistics Age-adjusted to the 2000 U.S. standard population
Racial Disparities of CVD in Michigan
Age-Adjusted Mortality Rates by Race and Gender for Cardiovascular Disease for Michigan, 2000-2006 Source: MDCH Vital Statistics Age-adjusted to the 2000 U.S. standard population
Age-Adjusted Mortality Rates by Race and Gender for Heart Failure for Michigan, 2000-2006 Source: MDCH Vital Statistics Age-adjusted to the 2000 U.S. standard population
Age-Adjusted Hospitalization Rates by Race and Gender for Michigan, 2000-2006 Cardiovascular Disease Heart Failure 2006 Black Males: 356.1 (per 10,000) 2006 White Females: 149.3 2006 Black Males: 98.8 (per 10,000) 2006 White Females: 27.8 Source: Michigan Resident Inpatient Files, Division for Vital Records and Health Statistics, MDCH Age-adjusted to the 2000 U.S. standard population
Age-Adjusted Hospitalization Rates by Race and Gender for Coronary Heart Disease for Michigan, 2000-2006 Source: Michigan Resident Inpatient Files, Division for Vital Records and Health Statistics, MDCH Age-adjusted to the 2000 U.S. standard population
Geography Of CVD in Michigan
Population Density Map Source: U.S. Census Bureau, 2000 Census
Cardiovascular DiseaseHospitalization Rates2002-2006 State Average: 203.3 (per 10,000) Arenac: 292.4 Bay: 266.2 Clare: 261.7 Gladwin: 263.2 Ogemaw: 250.0 Source: Michigan Resident Inpatients Data Files, Division for Vital Records and Health Statistics, MDCH Age-adjusted to the 2000 U.S. standard population
Heart DiseaseHospitalization Rates2002-2006 State Average: 157.6 (per 10,000) Arenac: 246.4 Bay: 223.4 Clare: 217.7 Gladwin: 221.0 Ogemaw: 210.1 Source: Michigan Resident Inpatients Data Files, Division for Vital Records and Health Statistics, MDCH Age-adjusted to the 2000 U.S. standard population
Coronary Heart DiseaseHospitalization Rates2002-2006 State Average: 74.5 (per 10,000) Arenac: 139.3 Bay: 120.5 Clare: 124.9 Gladwin: 121.0 Ogemaw: 117.6 Source: Michigan Resident Inpatients Data Files, Division for Vital Records and Health Statistics, MDCH Age-adjusted to the 2000 U.S. standard population
Heart FailureHospitalization Rates2002-2006 State Average: 38.0 (per 10,000) Arenac: 53.8 Bay: 46.6 Clare: 45.6 Gladwin: 53.7 Ogemaw: 46.2 Source: Michigan Resident Inpatients Data Files, Division for Vital Records and Health Statistics, MDCH Age-adjusted to the 2000 U.S. standard population
StrokeHospitalization Rates State Average: 27.1 (per 10,000) Arenac: 26.6 Bay: 25.9 Clare: 26.6 Gladwin: 26.8 Ogemaw: 21.9 Monroe: 33.2 Wayne: 33.6 Source: Michigan Resident Inpatients Data Files, Division for Vital Records and Health Statistics, MDCH Age-adjusted to the 2000 U.S. standard population
Cardiovascular Disease Mortality Rates Ogemaw Sanilac Source: MDCH Vital Statistics and CDC Wonder Age-adjusted to the 2000 U.S. standard population
Risk Factors of CVD in Michigan
Prevalence of Cardiovascular Disease Risk Factors, Michigan and United States, 1990-2007 Local Health Department data can be found at www.michigan.gov/brfs Source: CDC BRFSS
Obesity in Michigan Prevalence of overweight and obese adults, 18 and over, Michigan and United States, 2001-2007. Source: Michigan BRFS and CDC BRFSS
Risk Factor Clustering • 2.9% reported having no risk factors • Over 57% reported 3 or more • Only 4.0% of Michigan adults had all four healthy lifestyle characteristics (healthy weight, adequate fruit and vegetable intake, not smoking and engaging in adequate physical activity) Source: Michigan BRFS
Risk Factor Clustering Source: Michigan BRFS
Future of CVD in Michigan
Current Age Distribution of Michigan Residents, 2006 Source: MDCH Division of Vital Records and Health Statistics, 2006
Prevalence of Obese Youth, Grades 9 through 12, in Michigan, 1997-2007 Source: Michigan YRBS, CDC YRBS
Summary of Findings • The burden of CVD is higher in Michigan (297.2 deaths per 100,000) than the U.S. (277.3 deaths per 100,000) • Black males have the highest hospitalization rates for all diseases but coronary heart disease and the highest morality rate for all but heart failure • There is a 5 county contiguous region in Michigan that has high hospitalization rates for all CV diseases except for stroke • Next Steps • Look closer at the 5 counties that have high hospitalization rates • Examine co-morbidities with CVD • Work with partners to examine rehabilitation data • Perform a geographic analysis of out-of-hospital deaths, to observe proximity of the place of occurrence to hospitals. • Look at risk factor data in more detail and environmental design • A surveillance report on obesity will be coming out next year
Questions? • Contact: • Beth Anderson • AndersonB@michigan.gov • The Impact of Heart Disease and Stroke in Michigan: 2008 Report on Surveillance is available electronically at: • www.michigan.gov/cvh • www.michigan.gov/cvhepi
Resources • American Heart Association 2008 Statistical Update http://www.americanheart.org/downloadable/heart/1200078608862HS_Stats%202008.final.pdf • Michigan Community Health Information from Vital Statistics http://www.mdch.state.mi.us/pha/osr/chi/index.asp • Risk Factor Data by Community www.michigan.gov/brfs