Analyzing Interference Folding with Stereonets and Domain Analysis Techniques in Geology
This study explores the complex geometries of interference folds formed by multiple deformational events, which are pivotal in understanding orogenic belt evolution. The research aims to map and classify these folds using stereonet analysis and structural domain establishment. Key findings reveal the axial surface orientations of early and late fold generations, classified as type 3 interference folds. The methodology involves interpreting axial traces and creating a 3-D representation of the folded region, enhancing our comprehension of geological formations and folding patterns.

Analyzing Interference Folding with Stereonets and Domain Analysis Techniques in Geology
E N D
Presentation Transcript
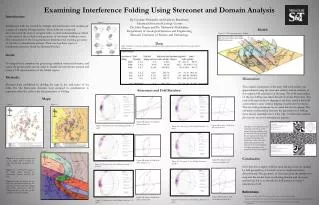
Examining Interference Folding Using Stereonet and Domain Analysis Introduction: Interference folds are formed by multiple deformational events resulting in a range of complex fold geometries. These folds are commonly encountered in the core of orogenic belts: so their understanding is critical to the study of the evolution and geometry of mountain building events. The orientations of the fold generations determine the resulting geometry of the fold, or interference pattern. There are four basic types of interference patterns, which are illustrated in fig 1. Goals: To interpretively complete the given map, establish structural domains, and create the proper stereonets in order to classify the interference pattern and create a 3-D representation of the folded region. Methods: Domains were established by dividing the map by the axial traces of the folds. For the Stereonets, domains were grouped in combinations to represent either the early or the late generation of folding. By Caroline Fernandez and Kathryn Boardman Advanced Structural Geology Course Dr. John Hogan and Dr. Mohamed Abdelsalam Department of Geological Sciences and Engineering Missouri University of Science and Technology Figure 1 Model: Figure 11: 3-D representation of folding Data: Table 1: Results of stereonet analysis of selected domain combinations that best illustrate the early and late folding events. Discussion: The original orientation of the early fold axial surface was approximated using the stereonet analysis and an estimate of the original fold axial trace on the map. The fold axial surface of the late folding was taken directly from the Stereonets. The early fold axial surface is dipping to the East and the late fold axial surface is near vertical, dipping towards the Northeast. The two fold generations are co-axial, but non co-planar. The orientation relationship between the generations of folding most closely resembles that of the type 3 interference pattern, also known as a hook interference pattern. Conclusion: Now that this complex fold has been broken down an studied by fold generations, it is much easier to understand three dimensionally. The geometry of the units from the interpretive map and the results from conducting domain and stereonet analysis has led us to classify the fold pattern as a type 3 interference fold. References: Stereonets and Fold Sketches: Maps: Figure 3 Figure 2 Figure 5B: Sketch of fold from data on figure 5A Figure 8B: sketch of fold from data on figure 8A. Figure 5A: Stereonet for early folding, domains 1, 8 and 7. Figure 8A: stereonet of late folding, domains 1, 2, and 3. The figure to the right shows the estimated orientations of the original fold axial surfaces with the early fold shown in red and the late fold shown in blue. The resulting Papermodel, once folded into a cube, shows the interference pattern in 3-D. Notice how the hooked pattern of folding correlates to the geometry of the units in figure 3. Figure 4 Figure 2: is the original geologic map of the folded region showing the strike and dip data recorded in the field. Figure 3: is an interpretive map of the folded region showing the approximate contacts between the units. Figure 4: shows the division of the map into structural domains by the axial traces of the folds. The straight lines are the axial trace of the late folding and the curved lines are the axial trace of the early folding. Figure 9B: sketch of fold from data on figure 9A. Figure 6B: sketch of fold from data on figure 6A. Figure 9A: Stereonet of late folding, domains4, 8, and 9. Figure 5A: Stereonet of early folding, domains 2, 9, and 6. G.H. Davis and S.J. Reynolds (1996). The structural geology of rocks and regions. 2nd Edition. Wiley Figure 10B: sketch of fold from data on figure 10A. Figure 7B: sketch of fold from data on figure 7B. “ Superposed Folding Papermodels” http://www.fault-analysis-group.ucd.ie/SuperPosedFolds/Superposed_PM_Index.html Figure 10A: Stereonet of late folding, domains 7, 6, and 5. Figure 7A: Stereonet of early folding, domains 3, 4, and 5 Ramsay, J.G., and Huber, M.I., 1987, The Techniques of Modern Structural Geology, Volume 2: Folds And Fractures