CHAPTER 8.2 MEASURING EARTHQUAKES
CHAPTER 8.2 MEASURING EARTHQUAKES. The study of SEISMOLOGY (earthquake waves) dates back 2000 years. 1. HSW: Earthquakes: The Science of Earthquake Prediction. 2. HSW: Earthquakes: The Science of Earthquakes. Earthquakes Waves. Surface Waves.

CHAPTER 8.2 MEASURING EARTHQUAKES
E N D
Presentation Transcript
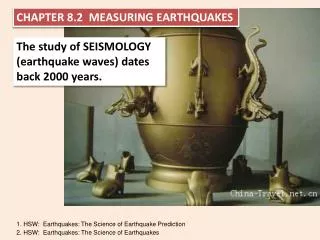
CHAPTER 8.2 MEASURING EARTHQUAKES The study of SEISMOLOGY (earthquake waves) dates back 2000 years. 1. HSW: Earthquakes: The Science of Earthquake Prediction 2. HSW: Earthquakes: The Science of Earthquakes
Earthquakes Waves Surface Waves = seismic waves that travel along earth’s surface. Shakes anything that they hit. Pg 224 Figure 7E & 7F Shaking trees video
Body Waves P Waves = seismic waves that travel through Earth’s interior. P waves = push-pull waves (compression waves) Alternates compressing and expanding material. Pg 224 Figure 7A & 7B Compare P and S Waves http://www.classzone.com/books/earth_science/terc/content/visualizations/es1002/es1002page01.cfm?chapter_no=visualization
Body Waves S Waves = seismic waves that travel through Earth’s interior. S waves = up-down waves Shakes particles at right angles to the direction they are traveling. Pg 224 Figure 7C & 7D
Surface Waves – Ocean type http://earthquake.usgs.gov/regional/nca/1906/simulations/movies/sf1906livermore.mov
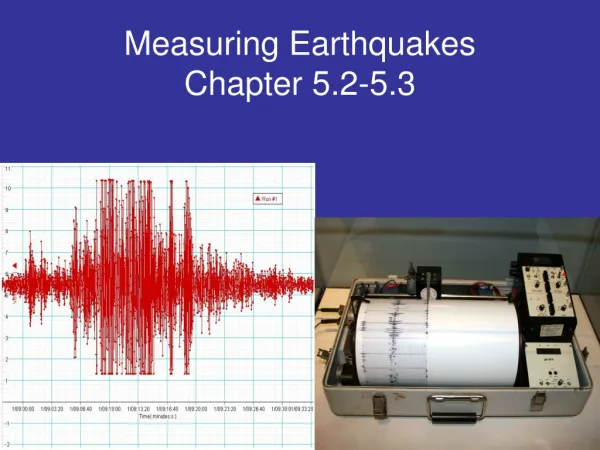
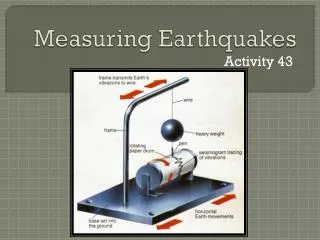
Seismogram = shows all three types of seismic waves – surface waves, P waves, and S waves. P waves travel fastest. S waves travel 1.7x slower than P waves. Surface waves travel slowest (90% of the speed of S waves. Pg 223 Figure 6 Surface waves P wave S wave How a Seismograph works. http://piers.wikispaces.com/How+a+seismogram+works+animation
Locating Earthquake Distance 1 min 1 min 1 min 1 min 3800 miles from station to epicenter 1000 2000 3000 4000 5000
Draw a circle correlating to the number of miles determined using the travel-time graph. Repeat with two more seismograms and drawing two more circles. Where the circles intersect is the epicenter! 3800 mi EPICENTER
Same techniques apply when using a map! Now try your hand at the Exploration Lab on page 240.
95% of major earthquakes occur in a few narrow zones. Ring of Fire around pacific rim. Earthquake zones
Two types of measurements to describe the size of an earthquake. A simple pattern of high intensity close to the San Andreas Fault, dropping off with distance. But why is there a disconnected island of high intensity in central California? The band of low (IV) intensity parallel to the coast coincides with the Coast Ranges. Soils here are very shallow - usually less than a meter to bedrock. Observers here felt mostly a sharp jolt. In contrast, the high intensity in central California coincides with the Central Valley, where young and unconsolidated sediments are kilometers deep. Unconsolidated material shakes like jelly in an earthquake. Note how intensity VI follows the shoreline of San Francisco Bay, where there are also thick unconsolidated sediments. Intensity = amount of shaking
Magnitude = quantitative measurement rely on calculations. Used by reporters. Google.com search “earthquakes” to see current earthquakes and access maps.
Moment Magnitude Chile 1960 moment magnitude map More precise. Used by scientists. Derived from the amount of displacement that occurs along a fault zone. • Derived from • Average movement along the fault. • Area of surface break. • Strength of broken rock. Most widely used measurement for earthquakes. Estimates energy released. Pg 227 Table 1
1886 Charleston SC 1985 Mexico City 1994 Northridge, CA 1971 San Fernando, CA 1995 Kobe, Japan 1999 Izmit, Turkey 2001 Bhuj, India 1999 Chi Chi, Taiwan 1964 Alaska 1993 Latur, India 2001 El Salvador 1990 Iran 1989 Loma Prieta, CA 1970 Peru 1988 Armenia 1988 Armenia 1960 Chile 1923 Tokyo