Download
1 / 48
480 likes | 651 Vues
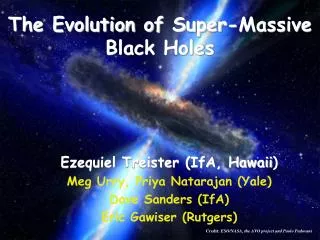
The Evolution of Super-Massive Black Holes. Ezequiel Treister (IfA, Hawaii ) Meg Urry, Priya Natarajan (Yale) Dave Sanders (IfA) Eric Gawiser (Rutgers). Credit: ESO/NASA, the AVO project and Paolo Padovani. Active Galactic Nuclei (AGN). Urry & Padovani, 1995. Black hole–galaxy connection.

E N D
The Evolution of Super-Massive Black Holes Ezequiel Treister (IfA, Hawaii) Meg Urry, Priya Natarajan (Yale) Dave Sanders (IfA) Eric Gawiser (Rutgers) Credit: ESO/NASA, the AVO project and Paolo Padovani
Active Galactic Nuclei (AGN) Urry & Padovani, 1995
Black hole–galaxy connection All (massive) galaxies have black holes Tight correlation of MBH with Common BH/SFR Evolution AGN feedback important
Black hole–galaxy connection All (massive) galaxies have black holes Tight correlation of MBH with Common BH/SFR Evolution AGN feedback important
MBH- Correlation Same relation for both active and non-active galaxies. Greene & Ho, 2006
Black hole–galaxy connection All (massive) galaxies have black holes Tight correlation of MBH with Common BH/SFR Evolution AGN feedback important
Common BH/Star Formation Evolution Marconi et al. 2004
Black hole–galaxy connection All (massive) galaxies have black holes Tight correlation of MBH with Common BH/SFR Evolution AGN feedback important
No AGN With AGN Feedback AGN Feedback Springel et al. 2005
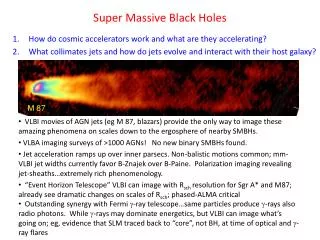
Supermassive Black Holes Many obscured by gas and dust • How do we know that? • Local AGN Unification • Explain Extragalactic X-ray “Background” Credit: ESO/NASA, the AVO project and Paolo Padovani
Observed X-ray “Background” Frontera et al. (2006)
AGN in X-rays Photoelectric absorption affect mostly low energy emission making the observed spectrum look harder. Increasing NH
Compton Thick AGN • Defined as obscured sources with NH>1024 cm-2. • Very hard to find (even in X-rays). • Observed locally and needed to explain the X-ray background. • Number density highly uncertain. • May contribute significantly to SMBH accretion. • Multiwavelength observations are required to find them. • Hard X-rays (E>10keV) very useful locally.
Swift INTEGRAL
ISDC Swift Sources Tueller et al. 2007
Deep INTEGRAL Survey (3 Msec) Significance Image, 20-50 keV
Log N-Log S Treister et al. 2009
Log N-Log S Treister et al. 2009
Fraction of CT AGN X-ray background does not constrain density of CT AGN Treister et al. 2009
X-Ray Background Synthesis Treister et al. 2009
Contribution of CT AGN to the XRB Only 1% of the XRB comes from CT AGN at z≥2. We can increase the # of CT AGN by ~10x and still fit the XRB. 50% 80% 90% Treister et al. 2009
CT AGN at High Redshift Treister et al. 2009
How to find high-z CT AGN NOW? X-rays Trace rest-frame higher energies at higher redshifts Less affected by obscuration Tozzi et al. claimed to have found 14 CT AGN (reflection dominated) candidates in the CDFS. Polletta et al. (2006) report 5 CT QSOs (transmission dominated) in the SWIRE survey. Tozzi et al. 2006
How to find high-z CT AGN NOW? Mid-IR X-ray Stacking F24/FR>1000 F24/FR<200 • 4 detection in X-ray stack. Hard spectral shape, harder than X-ray detected sources. • Good CT AGN candidates. • Similar results found by Daddi et al. (2007) Fiore et al. 2008
Extended Chandra Deep Field-South Area: 0.3 deg2 X-rays: Chandra 250ks/pointing Optical: Broad band UBVRIz (V=26.5)+ 18 Medium band filters (to R=26) Near-IR: JHK to K=20 (Vega) Mid-IR: IRAC 3.6-8 microns + MIPS 24 microns to 35 µJy Spectroscopy: VLT/VIMOS, Magellan/IMACS (optical) VLT/SINFONI, Subaru/MOIRCS (near-IR)
Mid-IR Selection • 211 sources with f24m/fR>1000 and R-K>4.5 • f24m>35Jy • 18 X-ray detected Log (f24µm/fR) R-K (Vega) Treister et al. ApJ submitted
X-ray Undetected X-ray Detected All Sources Redshift Distribution • Photo-z for ~50% of the sources • X-ray sources brighter at all wavelengths • Spec-z for 3 X-ray sources and photo-z for 12 (83% complete). Treister et al. ApJ submitted
Hardness Ratio NH X-ray sources with redshift only • 2 unobscured • 11 obscured Compton-thin • 2 Compton Thick Assumed fixed =1.9 Treister et al. ApJ submitted
Stacking of non-Xrays Sources Soft (0.5-2 keV) Hard (2-8 keV) • ~4 detection in each band. • fsoft=2.1x10⁻¹⁷erg cm-2s-1. Fhard= 8x10-17erg cm-2s-1 • Sources can be detected individually in ~10 Msec. • Hardness ratio 0.13, NH=1.8x1023cm-2. • Alternatively, ~90% CT AGN and 10% star-forming galaxies. • Some evidence for a flux dependence. >95% CT AGN at the brightest bin, 80% at the lowest. Large error bars. Treister et al. ApJ submitted
Rest-Frame Stacking Good fit with either NH1023cm-2 or combination of CT AGN with star-forming galaxies. Consistent results with observed-frame stacking. Treister et al. ApJ submitted
X-Ray to Mid-IR Ratio Both X-rays and 12µm good tracers of AGN activity. Observed ratios for X-ray sources consistent with local AGN (dashed line). Treister et al. ApJ submitted
X-Ray to Mid-IR Ratio Effects of obscuration in X-ray band luminosity. Only important for Compton Thick sources. Treister et al. ApJ submitted
X-Ray to Mid-IR Ratio ~100x lower ratio for X-ray undetected sources. Explained by NH~5x1024 to 1025cm-2 Treister et al. ApJ submitted
X-Ray to Mid-IR Ratio Ratio for sources with L12µm>1043erg/s (~80% of the sources) ~2-3x higher than star-forming galaxies Treister et al. ApJ submitted
X-Ray to Mid-IR Ratio Using Lx/L12µm=0.007 to separate AGN and star-forming galaxies ~80% AGN, consistent with HR value. In sources with L12µm>1044erg/s outside selection region fraction of AGN ~10%. Treister et al. ApJ submitted
Near to Mid-IR Colors • Distributions significantly different • X-ray detected sources much bluer • Average f8/f24=0.2 for X-ray sources and 0.04 for X-ray undetected sample Well explained by different viewing angle (30o vs 90o) in the same torus model Can it be star-formation versus AGN? Redder Bluer Treister et al. ApJ submitted
Near to Mid-IR Colors ULIRG, LINER ULIRG, Sey2 Armus et al. 2007
IRAC Colors AGN Faint 8 µm z>1 [3.6]-[4.5] (Vega) z=0-1 [5.8]-[8] (Vega) Treister et al. ApJ submitted
Optical/Near-IR SED Fitting X-ray Undetected X-ray Detected • Median stellar mass for X-ray detected sources ~4.6x10⁻¹¹ Msun. • For X-ray undetected source ~10-11 Msun. X-ray Detected • Mild extinction values found in general. • Maximum Av~4 mags. • Median E(B-V)=0.6 for X-ray detected sources and 0.4 for undetected ones. X-ray Undetected Treister et al. ApJ submitted
CT AGN Space Density Number of sources roughly consistent with extrapolation of Compton-thin LF z=0 LF Steeper evolution suggested by Della Ceca et al. (2008) and Yencho et al. (2009) work better Treister et al. ApJ submitted
CT AGN Space Density Systematic excess for Lx>1044erg/s sources relative to extrapolation of Compton-thin LF Strong evolution in number of sources from z=1.5 to 2.5. Consistent with heavily-obscured phase after merger? Treister et al. ApJ submitted
SMBHs Spatial Density Accretion efficiency 10%
UMBHs Spatial Density Natarajan & Treister, 2008
UMBHs Spatial Density • Self-Regulation • Momentum-driven winds (Murray et al. 2004). • Radiation pressure (Haehnelt et al. 98) • Energy Driven Superwind (King 05) Natarajan & Treister, 2008
Summary • Number of mildly CT sources at z~0 lower than expected. • Only ~1% of XRB comes from CT AGN at z~2. • Multiwalength surveys critical to find high-z CT AGN. • Mid-IR selection finds large number of CT AGN at z>1.5. Strong evolution in numbers up to z~3. • This could be evidence for a heavily obscured phase after quasar triggering. • Strong decrease in the number of UMBHs -> Self regulation process.