Download
1 / 11
110 likes | 129 Vues
Learn statistical inference, confidence intervals, estimating population mean, sample size, and margin of error in business contexts. Includes examples and practical applications.

E N D
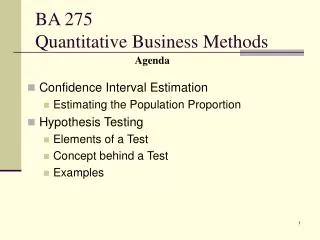
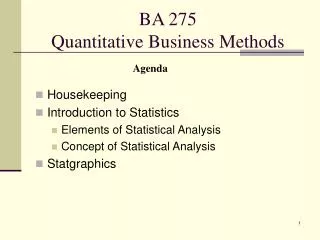
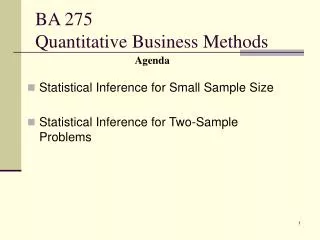
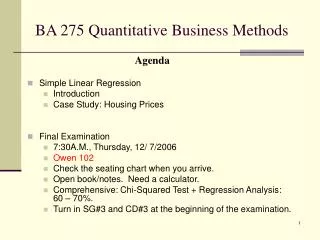
BA 275Quantitative Business Methods • Statistical Inference: Confidence Interval Estimation • Estimating the population mean m • Margin of Error • Sample Size Determination • Examples • Interval Estimation Using Statgraphics Agenda
Midterm Examination #1 • Monday, January 29, 2007 in class for 110 minutes. • It covers materials assigned in Week 1 – 3. • Need a calculator and a good night sleep. • Close book/note/friends. I will provide you • the empirical rule (similar to Figure 1.21 on p. 58) • the standard deviation formula (p.41), • the CLT (p. 292), and • the normal probability table. • Additional Office Hours • Saturday, 1/27/07, 9:00 – 11:30 a.m. • Monday, 1/29/07, 8:00 – 10:45 a.m.
Example 1 • A university administrator wanted to estimate the average number of times students at her university drank alcohol in the past month. A random sample of 92 students was surveyed by phone. The average number of times students in the sample drank was 5.6 times with a standard deviation of 6 times. • Calculate a 95% confidence interval for the average number of times all students at the university drank alcohol in the past month.
What does “95% confidence” mean? “95% Confidence” is a short way of saying “We use a method that gives correct results 95% of the time.”
Factors Affecting the Width of a Confidence Interval • Sample Size • Confidence Level • Standard Deviation Margin of error (m) How good is your point estimate?
Relations among m, n, and a m (margin of error) N (sample size) Fixed Confidence Level (e.g., 90%, 95%) Fixed
Estimation in Practice • Determine a confidence level (say, 95%). • How good do you want the estimate to be? (define margin of error) • Use the formula (p.371) to find out a sample size that satisfies pre-determined confidence level and margin of error.
Example 2 • An auditor is sampling inventory items in order to estimate the mean age of the items. (a “population mean” problem!) The auditor believes that the standard deviation is about 28. How large a sample is required to estimate the mean age to within 1 day? Assume that the confidence level is to be 99%.
Example 3 • An auditor is sampling inventory items in order to estimate the mean age of the items. (a “population mean” problem!) The auditor believes that almost all of the ages will be between 30 and 130 days. How large a sample is required to estimate the mean age to within 1 day? Assume that the confidence level is to be 99%.
Answer Key for Examples used • Example 1. • Example 2. • Example 3. • Estimate s with , then • To be more conservative, estimate s with , then • The CLT example • Q1: 0.281; Q2: 0.1251; Q3: 0.0000; Q4: Yes to all because the population distribution is normal.