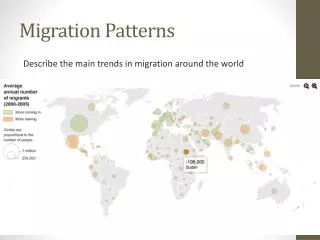
State and Regional Migration Patterns
This report presents an in-depth analysis of migration patterns in Michigan as documented by the Census Bureau. It includes data collected from the American Community Survey, revealing significant trends from 2005 to 2009. Michigan experienced a net loss in population due to out-migration, with major sources and destinations identified. The analysis highlights how economic conditions, such as the automobile industry, impacted migration trends over time. Additionally, county-specific population changes are provided, emphasizing the importance of understanding regional dynamics in migration.


State and Regional Migration Patterns
E N D
Presentation Transcript
State and Regional Migration Patterns Presented to the R2PC Executive Committee April 12, 2012
Migration Data Based on a Sample • Census Bureau has been collecting data on migratory patterns since 1940 • Migration data released March 28 as part of American Community Survey (ACS) • First release of migration data since 2000 • ACS Data collected on a rolling annual average
Migration Question from ACS • Question from ACS: “Where did this person live 1 year ago. • Respondents provide full address. • Sample gathered over five years.
Michigan Out-Migration vs. In-Migration, 2005-2009 • In-Migration – 128,400 • Out-Migration – 206,600 • Difference – 78,200 net loss
Top 10 Sources of In-Migration to Michigan, 2005-2009 • Florida – 13,300 • Ohio – 13,259 • Illinois – 11,150 • California – 7,828 • Indiana – 7,461 • Texas – 6,739 • New York – 4,887 • Wisconsin – 4,864 • North Carolina – 3,700 • Georgia – 3,520
Destination of Departing Michigan Residents by US Region, 2005-2009
Top 10 Destinations of Departing Michiganders, 2005-2009 • Florida – 23,645 • Ohio – 16,213 • Illinois – 13,742 • Texas – 13,144 • Indiana – 12,089 • California – 11,764 • Arizona – 10,826 • North Carolina – 7,829 • Georgia – 7,556 • Tennessee – 6,404
Net In-Migration • Alaska - 805 • Connecticut – 439 • Vermont - 144 • New Hampshire – 9 • Rhode Island - 9
Summary • Michigan has had a net outflow of population since 1998-99 • Still losing population due to negative out-migration, but significant improvement since 2007-2008 • Dependent on economic conditions the automobile industry • Out-migration peaks in mid-1970’s, early 1980’s (worst), and since 2000.
County Population Estimates, 2011 • Estimates released April, 2012 by Census Bureau • Components of population change include: • Natural increase/decrease (births minus deaths) • Net international migration (immigrants, emigrants, military personnel) • Net domestic migration
Components of Hillsdale County Population Change, 2010-2011 • Estimated population, July, 2010 – 46,626 • Natural increase (births minus deaths) – 73 • Net international migration – 27 • Net domestic migration – (208) • ESTIMATED POPULATION, July, 2011 – 46,518
Components of Jackson County Population Change, 2010-2011 • Estimated population, July, 2010 – 160,168 • Natural increase (births minus deaths) – 319 • Net international migration – 72 • Net domestic migration – (815) • ESTIMATED POPULATION, July, 2011 – 159,744
Components of Lenawee County Population Change, 2010-2011 • Estimated population, July, 2010 – 99,762 • Natural increase (births minus deaths) – 116 • Net international migration – 83 • Net domestic migration – (524) • ESTIMATED POPULATION, July, 2011 – 99,437
Components of RegionalPopulation Change, 2010-2011 • Estimated population, July, 2010 – 306,556 • Natural increase (births minus deaths) – 508 • Net international migration – 182 • Net domestic migration – (1,547) • ESTIMATED POPULATION, July, 2011 – 305,669
For further information Timothy Anderson, AICP, Principal Planner (517) 768-6703 tanderso@co.jackson.mi.us Web sites of interest: American Community Survey http://www.census.gov/acs/www/index.html Michigan Census http://www.michigan.gov/cgi/ US Census Bureau http://www.census.gov/