Download
1 / 22
220 likes | 237 Vues
The study examines the technical readiness, cost, and impact of various mission options for a follow-on to the QuikSCAT satellite. User input is sought regarding the potential impacts and desired simulations. Higher spatial resolution, full wind speed range, and improved coastal coverage are among the potential benefits.

E N D
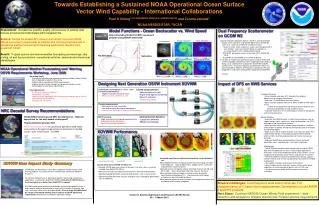
XOVWM User Impact StudyRita Simulations9/21/05:15:30 – 09/22/05:15:30 Contacts: Zorana.Jelenak@noaa.gov Paul.S.Chang@noaa.gov
QuikSCAT Follow-On Mission Options In June 2007, NOAA asked JPL to conduct a study to provide the technical readiness, cost, and impact to NOAA of (1M investment): • A QuikSCAT equivalent re-flight • An Extended Ocean Vector Winds Mission (XOVWM) • A constellation (2) of XOVWM instruments • A draft of the final report documenting results of this study will be ready by January, 2008
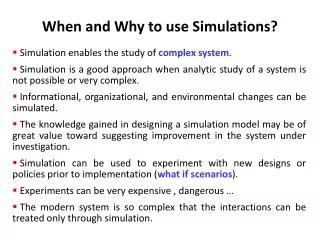
XOWVM Impact Study • As part of JPL study user input is needed regarding proposed mission options • Input desired by 4th of January • Mini wind workshop held at the end of NOAA Hurricane conference and study results were presented • GoTo meetings are set up to reach as many interested users as possible • Written statements from offices are desired addressing the following questions: • What realized impacts on your daily work would be continued if QuikSCAT-like instrument is launched (swell forecast?, ) • Based on simulation results presented what is perceived impact that new capability can bring to your areas of responsibility (no buoys in particular areas of interest, wind events affecting your particular region not observed so far…) • Due to time limitations simulation study is limited in its scope. In order to get more comprehensive understanding of new capability what are simulations that would be of interest for your area of responsibilities
Foreseen Impact on NOAA Operations • Higher spatial resolution (~5km) • Full wind speed range (to category 5), • Coastal coverage 2.5-5 km of land • Significantly better retrievals in rain impacted measurements • Areas of Emphasis: • Tropical cyclones (Katrina (4) and Rita (5)) • Extra-tropical cyclones (Helene, Seattle storm Dec 2006) • Coastal winds (dual low level jets off of Cape Blanco and Cape Mendocino, high wind events along the Alaska coast )
WRF Simulations • Initial/boundary conditions from • the GFDL 1/6th degree and 1deg resolution NCEP m • A set of three nested grids were used • outer most grid with a resolution of 12 km and covering ~5000x5000km • the middle grid with a resolution of 4km • inner most grid with a resolution of 1.3km and covering ~500x500km. • Used was a 6-class microphysical scheme (vapor, cloud liquid, rain, cloud ice, snow and graupel). This is one of the most complex from the currently available schemes.
Simulating Scatterometer Measurements Ku-band V, H pol Wind retrievals Ku-band V, H pol C-band V, H pol Simultaneous rain and wind retrievals – rain rate information not available
Rita – 1st Example 9/21/05 15:30 WRF Surface wind field 3km resolution WRF Simulated Rain Rates
Rita – 2nd Example 9/21/05 21:30 WRF Surface wind field 3km resolution WRF Simulated Rain Rates
Rita – 3rd Example 9/22/05 3:30 WRF Surface wind field 3km resolution WRF Simulated Rain Rates
Rita – 4th Example 9/22/05 9:30 WRF Surface wind field 3km resolution WRF Simulated Rain Rates
Rita – 5th Example 9/22/05 15:30 WRF Surface wind field 3km resolution WRF Simulated Rain Rates
Wind Radii 64kts 50kts 50kts 34kts 34kts 34kts 50kts 64kts QuikSCAT XOVWM WRF
Scatter Plots ofQSCAT Wind Speeds vs WRF Wind Speeds QuikSCAT significantly underestimates high wind speeds. The different plots show Hurricane Rita at different times of its evolution.
Max Wind WRF XOVWM QuikSCAT 09:21:15:30 09:21:21:30 09:22:3:30 09:22:9:30 09:22:15:30
Written Feedback on Following Questions is Desired by 4th of Jan ‘08 • What realized impacts on your daily work would be continued if QuikSCAT-like instrument is launched (swell forecast?, ) • Based on simulation results presented what is perceived impact that new capability can bring to your areas of responsibility (no buoys in particular areas of interest, wind events affecting your particular region not observed so far…) • Due to time limitations simulation study is limited in its scope. In order to get more comprehensive understanding of new capability what are simulations that would be of interest for your area of responsibilities Additional information available at: http://manati.orbit.nesdis.noaa.gov/SVW_nextgen/osvw_mini_workshop.html