Download
1 / 52
550 likes | 749 Vues
EFFECT OF VERY LONG-TERM ANTITHYROID DRUG THERAPY AND ITS COMPLICATION S. Ito Hospital Jaeduk Yoshimura Noh. How long is “very long-term”?. Duration of ATD therapy for Graves’ disease is 2-3 years; for extended treatment, RI or surgery is recommended

E N D
EFFECT OF VERY LONG-TERM ANTITHYROID DRUG THERAPY AND ITS COMPLICATIONS Ito Hospital Jaeduk Yoshimura Noh
How long is “very long-term”? • Duration of ATD therapy for Graves’ disease is 2-3years; for extended treatment, RI or surgery is recommended • More than 3 years of prolonged ATD therapy is given to patients who refuse RI or surgery • More than 20 years of ATD therapy was defined “very long-term”
Efficacy and complications of very long-term ATD therapy • Does longer duration of ATD therapy lead to improved remission rates? • Or affect the frequency and type of side effects? • Remission: to remain euthyroid for >1 year after ATD withdrawal
Subjects 574 untreated Graves’ disease patients - Initial diagnosis in 1987 *median ( ): range Sex: male 94 cases, female480 cases Age: 36*yrs(3~82) Thyroid weight: 49.6*g(14~146) Follow-up period:11.1*yrs(0.35~25.1) Thyroid function: FT3 19.2* pg/ml(5.5~25.0) FT4 7.43* ng/dl (1.92~10.0) TRAb 44.6* % (2.4~94.4)
Follow-up period 90 80 70 60 >15 yrs 34.4% 50 40 30 20 10 0 - all 574 cases - >20 yrs 22.1% No. of patients >10 yrs 52.8% >5 yrs 78.0% ~1 1~ 2~ 3~ 4~ 5~ 6~ 7~ 8~ 9~ 10~ 11~ 12~ 13~ 14~ 15~ 16~ 17~ 18~ 19~ 20~ 21~ 22~ 23~ 24~ 25~ Follow-up period (yrs)
Debatable points • Effects of ATD therapy could be assessed more accurately if all cases were treated with ATD alone and followed up long-term • However, patients undergo change of treatment due to side effects, goiter enlargement, patient request etc • Therefore, bias is inevitable in this study
Treatment methods for GD Radio Isotope 193 (33.6%) 574 cases ATD 319 (55.6%) Surgery 62 (10.8%)
Comparison of clinical factors ATD vs Surgery vs RI • Significant difference in remission-inducing factors among the 3 groups? • Comparison of initial clinical data - sex, age, FT3, FT4, TRAb, thyroid weight
Initial clinical data Age Sex 100 90 p<0.0001 p<0.0001 p<0.0001 80 80 70 60 60 50 40 40 30 20 20 10 0 0 ATD ATD Surgery Surgery RI RI median 322444 range 3~8210~5316~72 n31962 193 ーATD vs Surgery vs RIー % 28 (14.5%) 51 (15.9%) Male 15 (24.2%) Age (yrs) Female 165 (85.5%) 268 (84.1%) 47 (75.8%) (n) (319) (62) (193)
FT3 FT4 p=0.0137 30 p=0.0153 12 p<0.0001 p=0.0288 25 10 20 8 15 6 10 4 5 2 p<0.0001 0 ATD ATD Surgery Surgery RI RI 0 median 6.4510.07.8 range 1.95~101.98~101.92~10 n31162 187 median 17.923.719.8 range 5.5~257.6~256.8~25 n30761 191 Initial clinical data ーATD vs Surgery vs RIー FT4 (ng/dl) FT3 (pg/ml)
Initial clinical data TRAb Thyroid weight p=0.0169 p=0.0012 p=0.0007 p=0.0012 100 160 140 80 120 100 60 80 40 60 40 20 20 ATD ATD Surgery Surgery RI RI 0 0 ーATD vs Surgery vs RIー Thyroid weight (g) TRAb (%) median 38.459.2549.15 range 9.6~91.28.2~87.92.4~94.4 n30762 184 median 46.154.3552.2 range 3~146.119.1~12010~134.8 n31762 191
Conclusion-1 • ATD group had significantly lower FT3, FT4, TRAb levels and thyroid weight → lowest severity of Graves’ disease at initial diagnosis compared with surgery and RI groups
Subjects treated with ATDalone 318 untreated Graves’ disease patients - initial diagnosis in 1987 Sex: male51 case, female267 cases Age: 32*yrs(3~82) Thyroid weight: 46.2* g(14~146) Follow-up period:11.2*yrs(1.3~25.1) Thyroid function: FT3 17.9* pg/ml(5.5~25.0) FT4 6.45* ng/dl (1.95~10.0) TRAb 38.4* % (9.6~91.2) * median ( ): range *median ( ): range
30 25 20 >15 yrs 36.8% 15 10 5 0 1~ 2~ 3~ 4~ 5~ 6~ 7~ 8~ 9~ 10~ 11~ 12~ 13~ 14~ 15~ 16~ 17~ 18~ 19~ 20~ 21~ 22~ 23~ 24~ 25~ Follow-up period ATD group: 318 cases >20 yrs 24.2% No. of patients >10 yrs 54.4% >5 yrs 78.9% Follow-up period (yrs)
Proportion of active GD & remission Active 93 (29.2%) 318 cases Remission 180 (56.6%) <1-yr-ATD- discontinuation 45 (14.2%)
Cumulative incidence of remission cases in ATD group <1-yr–ATD-discontinuation cases not included % 100 80 Cumulative incidence 60 40 Follow-up period remission: 12.6 yrs (1.7~24.7) non-remission: 7.72 yrs (1.76~25.1) 20 0 yrs 0 5 10 15 20 25 8%/year achieve remission within 7 years of ATD therapy, but declines thereafter.
Cumulative incidence of remission casesin ATD & surgery & RI groups ーall 574 casesー % 100 80 Cumulative incidence 60 40 20 0 0 5 10 15 20 25 Time to remission (years)
Period of remission 25 20 Remission period(yrs) 15 10 5 median 6.4 yrs range 1.0~22.6 n 180 0 ー remission cases (final diagnosis)ー Some patients stop coming for follow-up visits after achieving remission, so longer remission period is conceivable.
FactorRemissionActive p value No. of patients 180 93 Sex (male: female) 29 : 15115: 78 n.s. Age 31 (3~82) 32 (10~62) n.s. FT3 (pg/ml) 18 (5.57~25) 17.9 (5.5~25) n.s. FT4 (ng/dl) 6.40 (2.06~10) 6.53 (1.95~10) n.s. TRAb (%) 35.4 (9.6~91.2) 43.4 (11.4~89) p<0.015 Thyroid weight (g) 46 (6.9~146.1) 46 (3~96.8) Initial clinical data Remission vs active
Initial TRAb analysis by ROC curve Cases of remission & active GD 100 80 60 40 20 0 Sensitivity(%) AUC 0.59090 0 20 40 60 80 100% Specificity (%)
Rate of relapseActive vs remission(final diagnosis) 100 80 60 40 20 0 % Relapsed 97 (64.2%) 再燃なし Relapsed 35 (67.3%) No remission No relapse Pearson p=0.0025 54 (58.8%) 17 (32.7%) active remission (n=93) (n=180)
Conclusion-2 • Within 7 years of ATD therapy, approximately 8%/year achieve remission, but decline thereafter • Remission or active GD cannot be predicted by observing initial clinical data
Prognoses of 20-year follow-up cases Active 23 (28.0%) 82 cases Remission 53 (64.6%) <1-yr-ATD- discontinuation 6 (7.3%)
Proportion of 20-year ATD-treated cases ≥20-yr follow-up (77) All cases (574) ATD-treated (318) ≥20-yr ATD-treated cases 23(29.9%) 23(7.2%) 23 (4.0%) • 23 cases
Initial clinical data of ≥20-year follow-up cases treated with ATD alone (exclude <1 yr-ATD-discontinuation cases) FactorRemissionActive p value No. of patients 53 23 Sex (male: female) 48 : 518 : 5 n.s. Age 29 (6~59) 36 (18~60) p=0.0122 FT3 (pg/ml) 18.4 (5.57~25) 14.8 (5.8~25) n.s. FT4 (ng/dl) 7.35 (2.39~10) 5.99 (1.95~10) n.s. TRAb (%) 37.8 (11.3~91.2) 41.7 (13.9~84.7) n.s. Thyroid weight (g) 45.9 (14~146.1) 32.1 (14~82) p=0.0024 Relapse : no relapse 16 : 37 11 : 12 n.s. Relapse count (times) 1 12 cases 5 cases 2 3 4 3 0 2 4 1
90 80 70 60 Thyroid weight (g) 50 40 30 20 10 0 1st visitafter 20 yrs of ATD 33.8 g (7.6-82) 27.1(13.6-68.9) Change in thyroid weight ー ≥20-year ATD-treated cases (11) ー Paired t p=0.3551
Conclusion-3 • Some cases do not attain remission despite a goiter that is relatively small or not enlarging
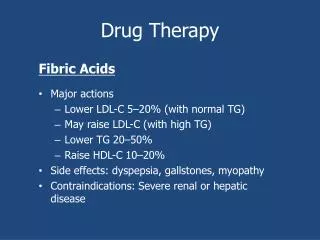
MMI total 131 PTUtotal 18 108 106 104 102 18 16 14 12 10 8 6 4 2 0 Type and frequency of side effects during initial ATD therapy ~ ~ No. of cases altered taste sensation leuko -penia liver damage joint pain muscle pain body aches head- ache skin rash agra itching fever Side effects
Time to onset of initial side effects MMI PTU 80 78 ~ ~ 14 12 10 Time to onset (months) 8 6 4 2 0 altered taste sensation leuko -penia liver damage joint pain muscle pain body aches head- ache skin rash agra itching fever Side effects
Side effectsafter resuming ATD therapy Sex: male 15 cases, female 104 cases Age: 28*yrs(10~64) Thyroid weight: 32.4*g(3~82) Drug withdrawal: 10*mths(2~241) Re-administered ATD: MMI 141, PTU 31 • Retrospective study of 172 episodes requiring ATD re-administration in 119 patients. Period of drug withdrawal was more than 2 months.
Side effects after resuming ATD therapy ATD Time to onset after type of Dose Side effectswithdrawal resuming ATD Others ATD (mg/day) (months)(days) skin rashMMI 5 11 38 Case 1 skin rash MMI 20 4 34 Case 2 skin rash MMI 30 9 14 Case 3 skin rash MMI 10 38 2 transient AST 75 Case 4 MMI 15 9 29 liver damage ALT 146 migratory MPO-ANCA Case 5 PTU 100 8 881 joint pain related vasculitis 41EU Case 6 granulocytosis MMI 30 19 125 Neu 800
Onset of agranulocytosis after resuming ATD Cases with no adverse effects during initial ATD therapy
Characteristics of patients with agranulocytosis Variables Resumed First given p value No. of patients 13 33 Age (yrs) 42.5 (22~74) 38 (18~61) 0.3286 Sex (male / female) 0 / 13 1 / 32 ATD (MMI / PTU) 9 / 4 27 / 6 Duration of drug 36.6 (5.1~270) ー withdrawal (monts) Duration of continuous ATD intake 33 (21~95) 39.5 (21~98) 0.7539 before onset of agranulocytosis Daily dose at onset of MMI 30 (5~35) 20 (10~30) 0.9226 agranulocytosis (mg/d) PTU 200 (150~300) 300 (250~300) 0.0404
Clinical Characteristics of MyeloperoxidaseAntineutrophil Cytoplasmic Antibody-AssociatedVasculitis Caused by Antithyroid Drugs Jaeduk Yoshimura Nohet. al(J Clin Endocrinol Metab 94: 2806–2811, 2009) (1) 92 patientswith MPO-ANCA-associated vasculitis (2) Median time to onset was 42 months (range 1~372 months) after starting drug treatment.
Conclusion • Side effects may occur after resuming ATD without occurring during initial therapy • MPO-ANCA-associated vasculitis rarely occurs; time to onset varies • Risk of adverse effects should be noted at all times during ATD therapy
Thank you for your kind attention. Jaeduk Yoshimura Noh
80 75 MMI 141例中 PTU 31例中 70 65 60 45 40 35 30 25 20 15 10 5 0 WBC 減少症 agra 肝障害 関節痛 筋肉痛 全身痛 掻痒 頭痛 発疹 発熱 味覚異常 ATD内服による副作用 ~ ~ 発 生 頻 度 (%) 副作用
観察期間 25 20 15 10 5 0 ー全症例 574例ー >20 yrs 22.1% >15 yrs 34.4% Follow-up period(yrs) >10 yrs 52.8% >5 yrs 78.0%
初診時年齢と寛解、非寛解の比率 100 80 60 40 20 0 寛解 なし あり (n) (52) (151) (63) (6) (1) 42 (66.7%) 97 (64.2%) 35 (67.3%) 5 (83.7%) 1 (100%) % 21 (33.3%) 54 (58.8%) 17 (32.7%) 1 (16.7%) ~20 ~40 ~60 ~80 80~ 初診時年齢(歳)
20年以上非寛解群 その他の群 160 25 140 120 20 100 15 80 60 10 40 5 20 0 0 初診時FT3 vs TRAb, thyroid weight vs TRAb ーATD群での20年以上非寛解群とその他群ー Thyroid Weight (g) FT3 (pg/ml) 0 10 20 30 40 50 60 70 80 90 100 0 10 20 30 40 50 60 70 80 90 100 TRAb (%) TRAb (%)
結 果 • 副作用は計7例(4.1%) 。 • 治療法変更を必要としない軽度肝障害が1例(0.6%) (中断期間*9ヶ月)。 • 発疹は3例(1.7%)。2例(*4、11ヶ月)は薬剤変更無く改善。1例(*38ヶ月)は薬剤変更が必要であった。 • PTU投与に伴う軽度関節痛とP-ANCA上昇例が1例(0.6%)(*13ヶ月)。 • MMI再開後4ヶ月で発熱と白血球減少(Neu800)にて入院加療を要した例が1例(0.6%) (*19ヶ月)。
Variables Resumed First given p value No. of patients 16 34 Age (yr) 42.5 (17~74) 41.5 (18~61) 0.7946 Sex (male/female) 1/15 1/33 ATD (MMI/PTU) 12/4 28/6 Duration of drug withdrawal 987 (98~8128) - Interval between initiation of ATD therapy 2272 (723~9681) 41 (21~4187) <0.0001 and onset of agranulocytosis Duration of continuous ATD intake 34 (21~95) 39.5 (21~98) 0.7945 before onset of agranulocytosis Daily dose at onset of agranulocytosis (mg/d) MMI 27.5 (5~40) 20 (10~30) 0.9139 PTU 200 (150~300) 300 (250~300) 0.0537 Cumulative dose at onset of agranulocytosis (mg/d) MMI 2905 (570~11915) 1280 (340 - 8760) 0.0612 PTU 59325 (34900~108750) 7750 (6600~8700) 0.0105 Laboratory findings at onset of agranulocytosis WBC 700 (180~2840) 1750 (100 - 3690) 0.0562 Granulocyte count 60 (0~432) 68 (0~295) 0.7531 Febrile episode (>30.0℃) [n(%)] 11 (69) 22 (65) documented infection [n(%)] 5 (31) 11 (32) Initial treatment of agranulocytosis G-CSF 10 27 Steroids 0 3 Supportive care 2 3 Unknown 4 1 Patient fatalities [n(%)] 0 1 (3) Number of aplastic anemia [n(%)] 1 (6) 2 (6) Interval between onset of agranulocytosis and recovery 7(1~14) 7(0~22) 0.6544 Characteristics of patients with agranulocytosis
初診時データの比較 Sex Age 100 % 70 80 60 60 50 40 40 30 20 20 10 0 0 非寛解 寛解 ー20年間経過観察した寛解群と非寛解群ー 男性 p=0.0120 5 (9.4%) 5 (15.9%) Age (yrs) 女性 48 (90.6%) 18 (84.1%) 非寛解 寛解 median 3629 range 18~606~59 n2353 (n) (23) (53)
初診時データの比較 FT4 FT3 25 20 15 10 5 0 非寛解 非寛解 寛解 寛解 median 14.818.4 range 5.8~255.57~25 n2352 median 5.997.35 range 1.95~102.39~10 n2352 ー20年間経過観察した寛解群と非寛解群ー 10 8 6 FT4 (ng/dl) FT3 (pg/ml) 4 2 0