Download
1 / 2
20 likes | 86 Vues
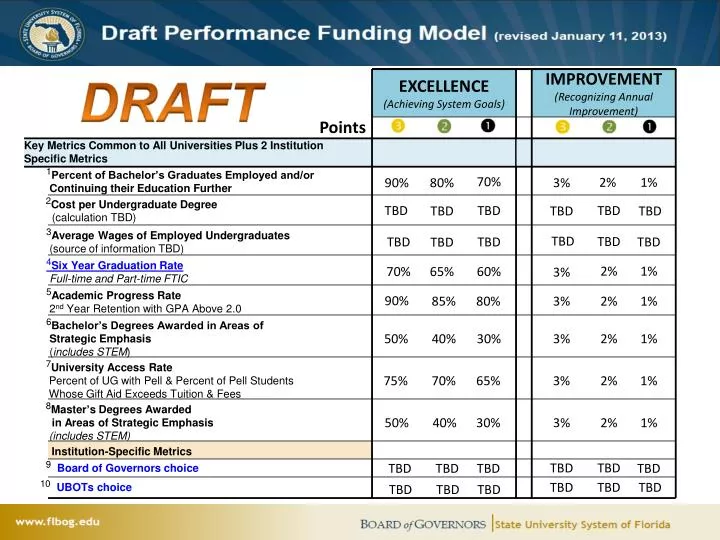
EXCELLENCE (Achieving System Goals). IMPROVEMENT (Recognizing Annual Improvement). Points. Key Metrics Common to All Universities Plus 2 Institution Specific Metrics. 1 Percent of Bachelor’s Graduates Employed and/or Continuing their Education Further. 70%. 2%. 1%. 90%. 80%. 3%.

E N D
EXCELLENCE (Achieving System Goals) IMPROVEMENT (Recognizing Annual Improvement) Points Key Metrics Common to All Universities Plus 2 Institution Specific Metrics 1Percent of Bachelor’s Graduates Employed and/or Continuing their Education Further 70% 2% 1% 90% 80% 3% 2Cost per Undergraduate Degree(calculation TBD) TBD TBD TBD TBD TBD TBD 3Average Wages of Employed Undergraduates (source of information TBD) TBD TBD TBD TBD TBD TBD 4Six Year Graduation Rate Full-time and Part-time FTIC 2% 1% 70% 65% 60% 3% 5Academic Progress Rate 2nd Year Retention with GPA Above 2.0 90% 80% 85% 3% 2% 1% 6Bachelor’s Degrees Awarded in Areas of Strategic Emphasis (includes STEM) 50% 40% 30% 3% 2% 1% 7University Access Rate Percent of UG with Pell & Percent of Pell Students Whose Gift Aid Exceeds Tuition & Fees 65% 75% 70% 3% 2% 1% 8Master’s Degrees Awarded in Areas of Strategic Emphasis (includes STEM) 50% 40% 30% 3% 2% 1% Institution-Specific Metrics TBD TBD TBD TBD TBD TBD 9Board of Governors choice TBD TBD TBD 10UBOTs choice TBD TBD TBD
95 95 93 82 81 79 UF 77 AAU +- 2 σ 75 73 71 AAU 6-Yr Graduation Rate Mean 71 68 59 55 53 FGCU Peer +- 2 σ 53 51 48 FGCU Peers 6-Yr Graduation Rate Mean 46 45 FGCU 37 35 31 28 Mean FGCU Aspirant Peers Mean AAU Publics FGCU UF