Advanced Visualization of Atmospheric Data from Aqua Satellite Infrared Sounders
160 likes | 257 Vues
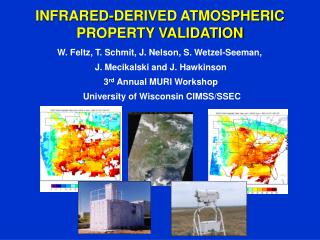
This project focuses on processing infrared data collected by the Aqua satellite's instruments since 2002. The emphasis is on visualizations that help analyze and understand atmospheric phenomena, particularly hurricanes. The processing of the data involves converting raw observations into a gridded format, describing the spatial sensitivity distribution, and refining the mesh for accurate visualization. The Observation Coverage Model is used to determine how observations are split into grid cells, with the spatial response function integral playing a crucial role in this process. The Obscov algorithm, developed as part of this research, refines the mesh to eliminate unnecessary artifacts in the visualization, particularly at high resolutions. The methodology was applied to datasets collected during Hurricane Bill and shared with Florida Atlantic University (FAU). This project aims to enhance the precision and accuracy of visualizing infrared satellite data to improve our understanding of atmospheric dynamics.

Advanced Visualization of Atmospheric Data from Aqua Satellite Infrared Sounders
E N D
Presentation Transcript
David Chapman Milt Halem Processing Infrared Sounders for Atmospheric Visualizations
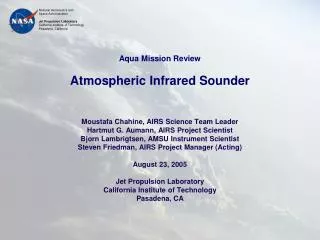
Aqua satellite monitors Infrared since 2002 - AIRS 2378 frequencies 14 KM spatial resolution - MODIS 16 frequencies 1KM spatial resolution Infrared Satellite Processing Systems
Geo-reprojection Collection to Visualization Approach Hurricane Visualization Raw Observations Animated Climate Visualization
Gridding Convert Observations from orbital projection to a lat/lon grid
Observations over a 2D area Spatial Response Function describes sensitivity distribution Observation Coverage Model
Obscov Model Given an observation Determine Coverage • How does observation split into grid cells • Integral of Spatial Response Function over grid cell area.
Effect on Hurricanes Observation Coverage model produces precise grids, and corrects needless artifacts • Removes Stippling at high resolutions
Obscov Method Polygon integral base case
Conclusion Developed Obscov Algorithm Processed 5KM AIRS and MODIS Datasets over Hurricane Bill, and distributed to FAU