Download
1 / 1
10 likes | 104 Vues
Explore the relationship between upper tropospheric humidity and cirrus clouds using AIRS and CALIPSO data with ECMWF forecast evaluations. Understand the influence of vertical resolution on ice supersaturation. Results show difficulties in ice supersaturation detection and its impact on cloud properties.

E N D
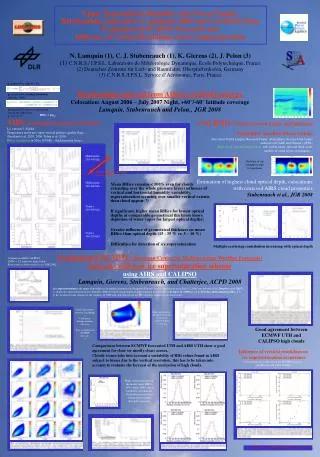
Upper Tropospheric Humidity and Cirrus Clouds: Relationships Inferred by Combined AIRS and CALIPSO Data, Evaluation of ECMWF Forecasts and Influence of Vertical Resolution on Ice SupersaturationN. Lamquin (1), C. J. Stubenrauch (1), K. Gierens (2), J. Pelon (3)(1) C.N.R.S./ I.P.S.L. Laboratoire de Météorologie Dynamique, Ecole Polytechnique, France(2) Deutsches Zentrum für Luft- und Raumfahrt, Oberpfaffenhofen, Germany(3) C.N.R.S./I.P.S.L. Service d’Aéronomie, Paris, France qsintegrated by steps of 1 hPa: Relationships inferred from AIRS-CALIPSO synergy Colocation: August 2006 – July 2007 Night, +60°/-60° latitude coverage Lamquin, Stubenrauch and Pelon., JGR 2008 ps calculated by Sonntag’s formulae (Sonntag, 1990): q determined by means of the mixing ratio in the AIRS layer: q = w / (1+w) RHice = q/qsat AIRS(Atmospheric Infrared Sounder) L2, version 5, NASA Temperature and water vapor vertical profiles, quality flags… (Susskind et al. 2003, 2006; Tobin et al. 2006) RHice calculation in 50 to 100 hPa – thick pressure layers CALIPSO(Cloud-Aerosol Lidar and Infrared Pathfinder Satellite Observation) Data from NASA Langley Research Center Atmospheric Science Data Center archived at ICARE and Climserv (IPSL) High cloud top and base pressure: sub-visible cirrus, thin and thick cirrus number of cloud layers, tropopause… Estimation of highest cloud optical depth, colocations with retrieved AIRS cloud properties Stubenrauch et al., JGR 2008 Midlatitudes 250-300 hPa Distance of top of highest cloud to tropopause Separation into two classes of optical depth Midlatitudes 300-400 hPa Mean RHice remains < 100% even for clouds extending over the whole pressure layer (influence of vertical and horizontal humidity variability, supersaturation occuring over smaller vertical extents than cloud appear ?) If significant, higher mean RHice for lowest optical depths at comparable geometrical thickness (more depletion of water vapor for largest optical depths) Greater influence of geometrical thickness on mean RHice than optical depth (15 - 35 % vs. 5 – 10 %) Difficulties for detection of ice supersaturation Tropics 150-200 hPa Tropics 200-250 hPa Multiple-scattering contribution increasing with optical depth Evaluation of ECMWF (European Center for Medium-range Weather Forecasts) forecasts with new ice supersaturation scheme using AIRS and CALIPSO Lamquin, Gierens, Stubenrauch, and Chatterjee, ACPD 2008 Comparison AIRS-CALIPSO, LMD vs. L2 retrievals, high clouds. From study in Stubenrauch et al. (JGR 2008) Ice supersaturation in the upper troposphere is an explicit feature in the Integrated Forecast System, operational since Sept 13, 2006, was introduced by Tompkins et al. (2007), it adopts the supersaturated relative humidity (RH) threshold using empirical approximation of the results of Koop et al. (2000) given by Kärcher and Lohmann (2002), f(T). It has produced some changes in the statistics of UTH and cloud fraction in the IFS (decrease in high-level cloud cover). Small adjustments for vertical griddings ← Colocation: Europe window One year Two resolutions of ECMWF forecasts → Spin up phase for the model to reach constant ice supersaturation occurrence → Good agreement between ECMWF UTH and CALIPSO high clouds Comparisons between ECMWF forecasted UTH and AIRS UTH show a good agreement for clear (or mostly clear) scenes. Cloudy scenes take into account a variability of RHi values found in AIRS subject to biases due to the vertical resolution, this has to be taken into account to evaluate the forecast of the nucleation of high clouds. Influence of vertical resolution on ice supersaturation occurrence Confronting two resolutions in the ECMWF forecasts, Comparison with radiosoundings High cloud nucleation in the model resets RHi to 100% while AIRS sees a variability of situations. Distributions consistent with previous results (first part of poster). Contact: nicolas.lamquin@lmd.polytechnique.fr